Yellow
Green
Blue
Red
Magenta
Remove
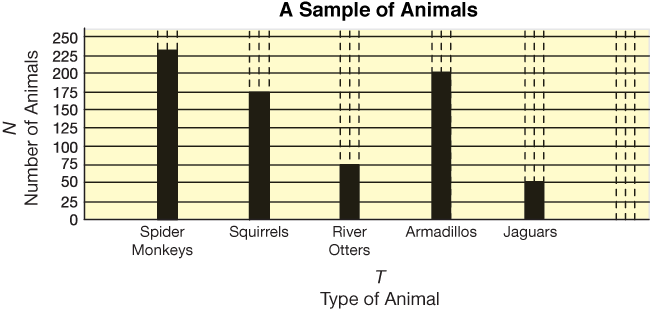
Here is the graph of the Robinsons' data.


- What variables do the letters T and N stand for?
- What variable is on the horizontal axis (
 )?
)? - What variable is on the vertical axis (
 )?
)? - At the beginning of the experiment, the Robinsons chose values for the variable Type of Animal. Two of these values are Spider Monkeys and Jaguars. What are the other values for this variable?
- What values for the variable Number of Animals did the Robinsons record in their data table?
- Look at the vertical axis on the graph the Robinsons made to display their data. How did they scale this axis? Why do you think they chose to do it this way?
- What is the most common animal in the sample? Least common?
- Predict which two animals are the most common in the whole population.
Conduct a similar experiment using a bean population instead of different animals in the rain forest. Use the Kind of Bean Lab pages in the Student Activity Book and the TIMS Laboratory Method. Pull a sample of beans from a container and count the number of each kind of bean. Use the data to predict which kind of bean is the most common and which is the least common in the bean population.


