Lesson 5

Using Picture Graphs

Est. Class Sessions: 1–2

Daily Practice and Problems

Teacher Notes
X

TIMS Task

  1. 18 navy beans.

    Strategies may vary. Students may find the total number of beans in the table (36) and then count up to find the missing portion (18).
  2. kidney beans
  3. pinto and lima beans
  4. 18. Possible response: I subtracted 6 from 24 to get 18. 24 − 6 = 18

Ongoing Assessment

Use DPP Item R to assess students' abilities to draw scaled bar graphs from a table [E2], read a table or scaled graph to find information about a data set [E3], and solve one- and two-step problems using data in scaled bar and picture graphs [E5].

R. Sample of Beans

Sun Feng took samples of beans. He pulled fifty-four beans.

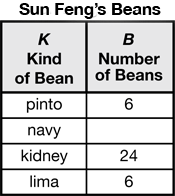
  1. How many navy beans should he have recorded? Show or tell how you know.
  2. Which bean was the most common?
  3. Which bean was the least common?
  4. How many more kidney beans than lima beans did Sun Feng pull? Show or tell how you know.
  5. Draw a graph of Sun Feng's data.