Once data is collected, students display it in a point graph in Check-In: Question 6. See Figure 4 for a sample graph. Distribute a copy of the Centimeter Graph Paper Master to each student. Discuss which variable goes on each axis. It is a scientific convention to graph the variable listed in the first column of the data table on the horizontal axis and the variable in the second column on the vertical axis. See Content Note.

Labeling the Axes. An important question that arises when making graphs is how to decide which variable to plot on each axis. When making a point graph, it does not really matter which variable is plotted on each axis. However, if several different groups are doing a similar investigation, it is difficult to compare data unless each group makes similar graphs. Therefore, scientists and mathematicians have developed several conventions, that is, general agreements about procedures, for deciding which variable to plot on each axis.
Scientists and mathematicians have adopted the convention of graphing the first column in a data table on the horizontal axis and the last column on the vertical axis. Another convention that we will point out to students later is that scientists usually choose to make the first column the one that can be filled out before collecting data. We call this variable the manipulated variable or the independent variable. The last column is reserved for the variable we collect during an investigation. We call this variable the responding variable or the dependent variable. Therefore, the manipulated variable is usually graphed on the horizontal axis and the responding variable on the vertical axis. The ability to identify the manipulated and responding variables in an experiment is important, and we will discuss this in Grades 4 and 5.
- How should you label the axes on the graph? (Students' responses will vary.)
- What values do you know before we begin the investigation? Let's put that on the horizontal axis. (Number of Objects)
Discuss how the axes should be numbered. Since they will be using the graph to make predictions, students should leave some room for extrapolation. Counting by ones on the horizontal axis is fine since 0 through 15 will fit.
- How should you number the horizontal axis? (Possible response: Start with 0 and number by ones; 0, 1, 2, 3, etc. up to 15.)
- What are you trying to find out by doing the investigation? (the mass of the objects)
- What variable should you put on the vertical axis? (Mass in grams)
- How should you number the vertical axis?
Numbering the vertical axis is not so straightforward. Numbering by tens, for instance, will allow students to graph up to 200 grams—perhaps not enough for extrapolating. At this stage, however, it might be best to let students decide. If they encounter difficulties when extrapolating, they can always renumber the axes and reconstruct the graph or tape on additional graph paper to enlarge it.
- What should you title the graph? (Mass vs.Number)
Ask students to create a point graph in Check-In: Question 6 and use it to answer Questions 7–8.
If students are careful when collecting and graphing data, their data points should fall close to a straight line.
When they are done making the graphs, ask:
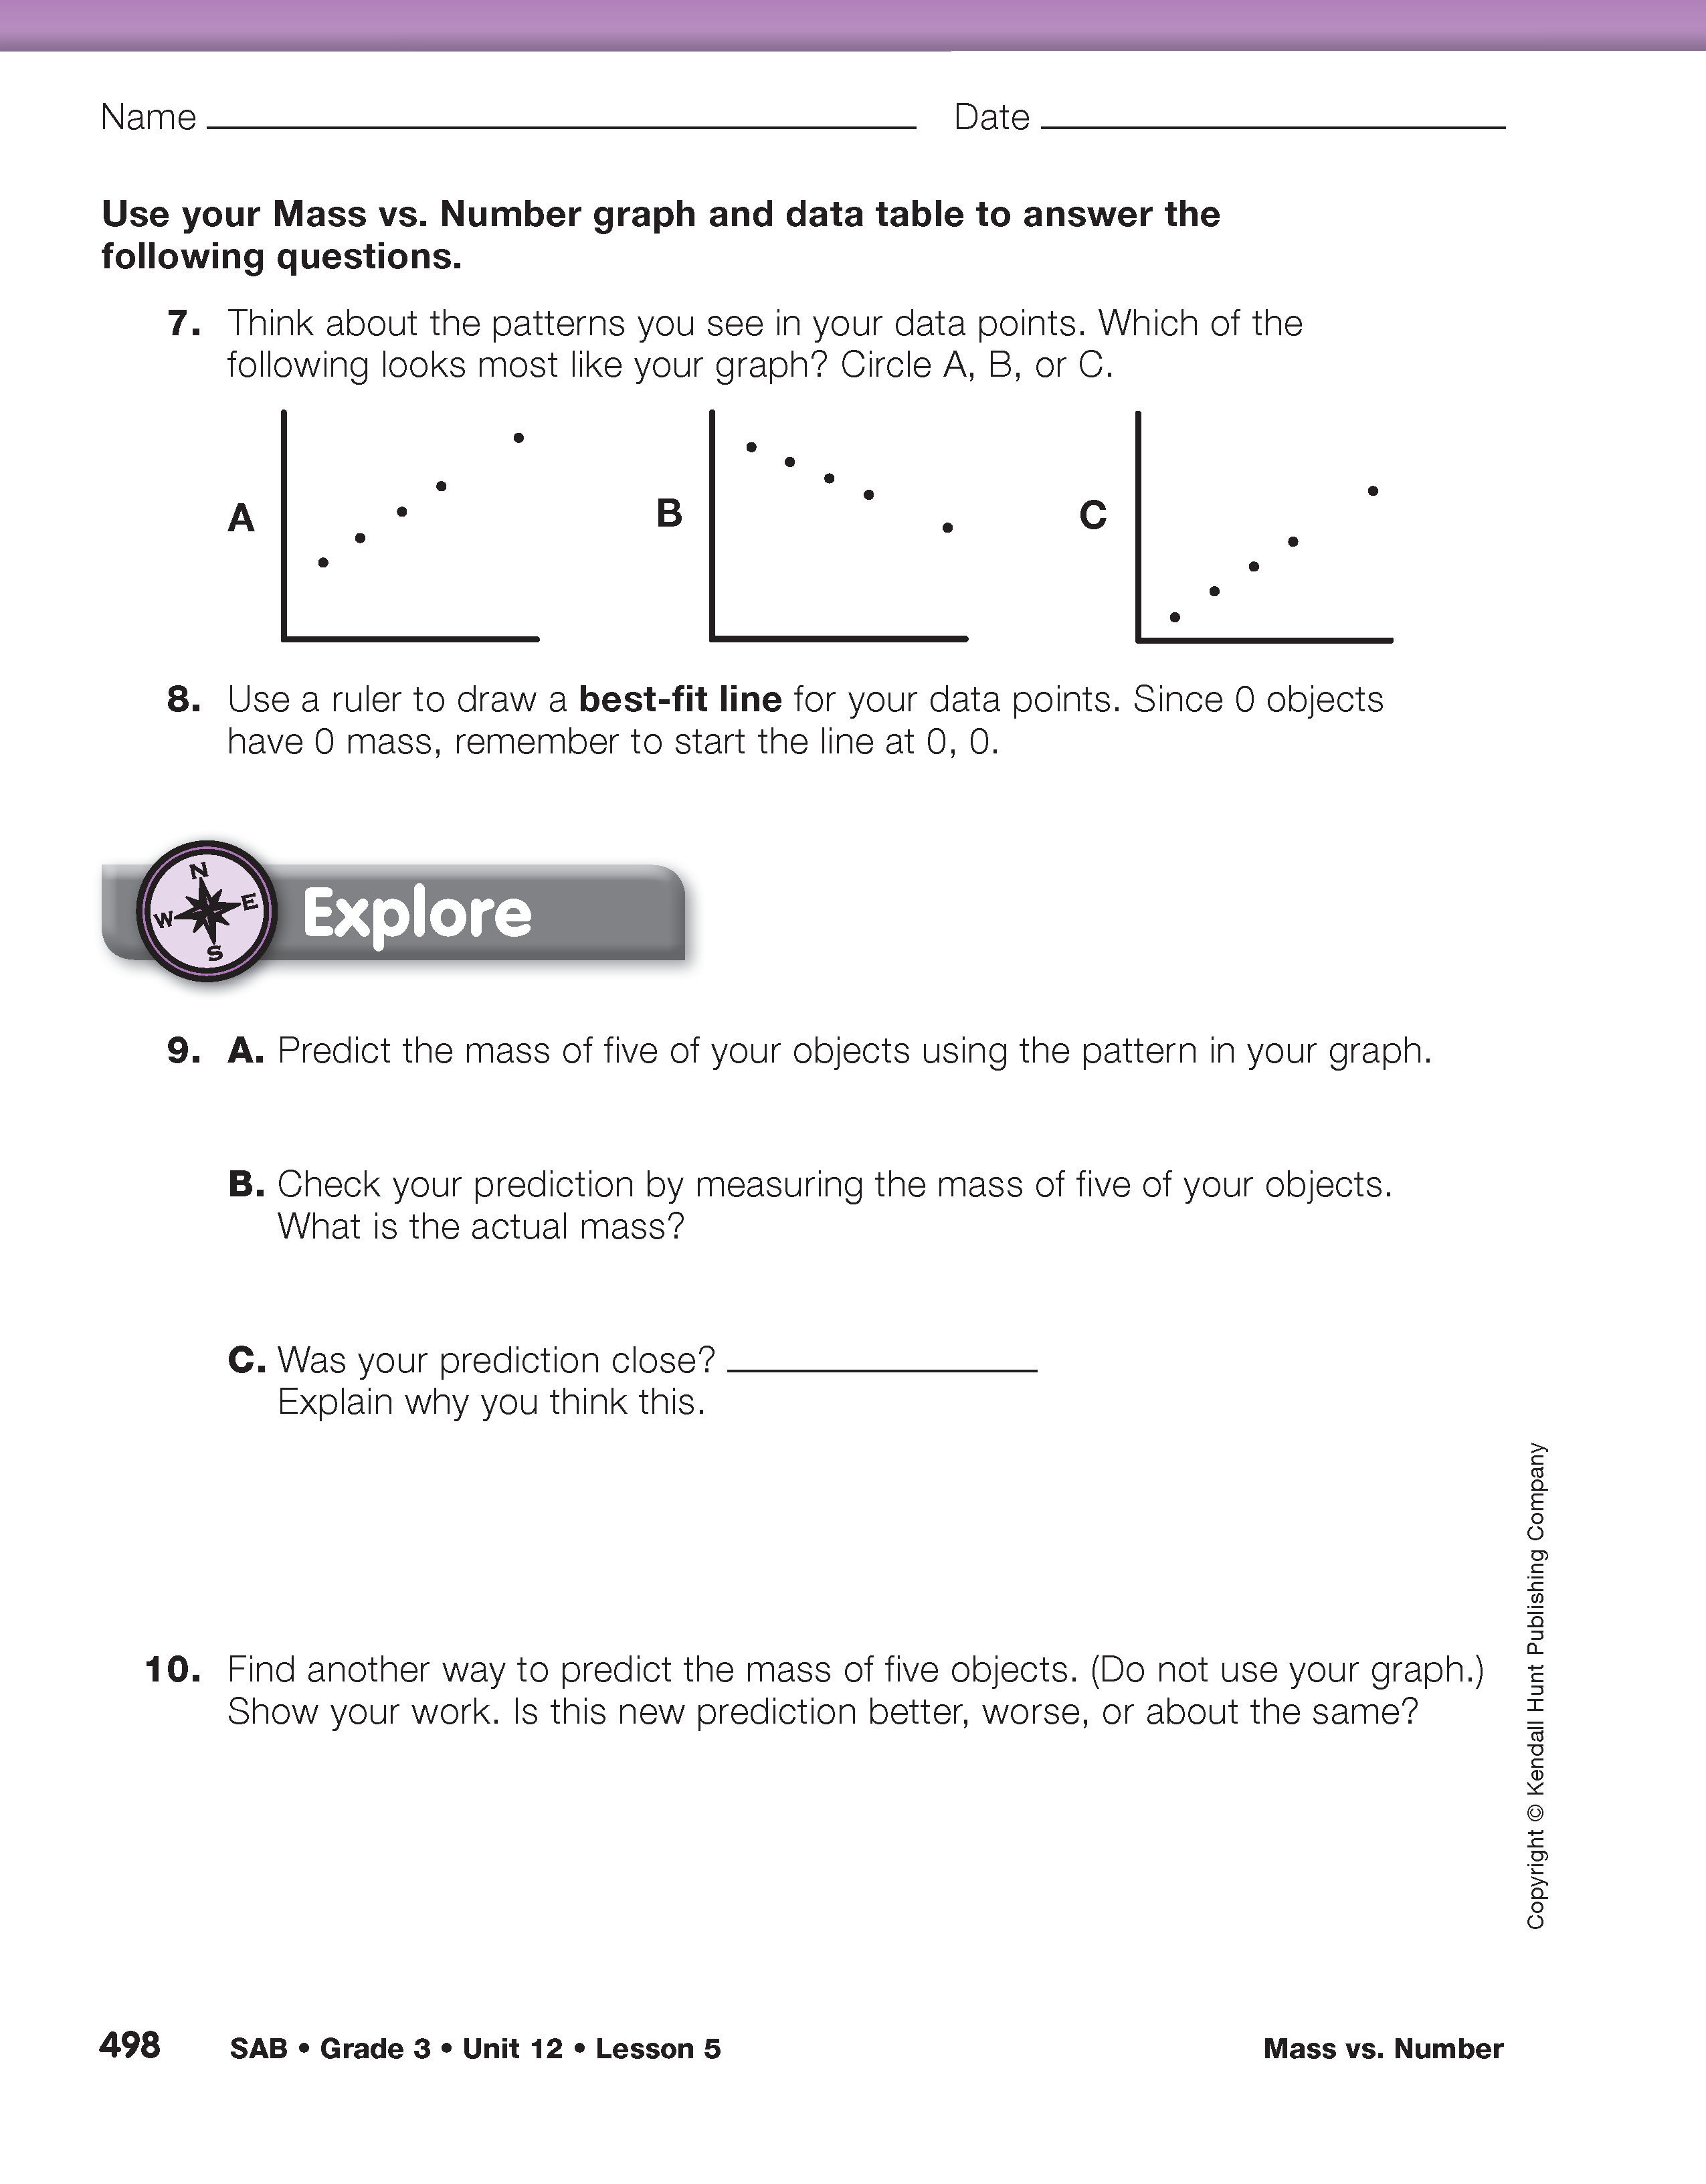
- What patterns do you see in your data points (Question 7)? (Possible response: Most of the points fall in a straight line, but not all of them.)
- Why doesn't the data lie exactly on a straight line? (All the measurements are subject to measurement error; see Mathematics in this Unit. In addition, the objects may not all have the same mass.)
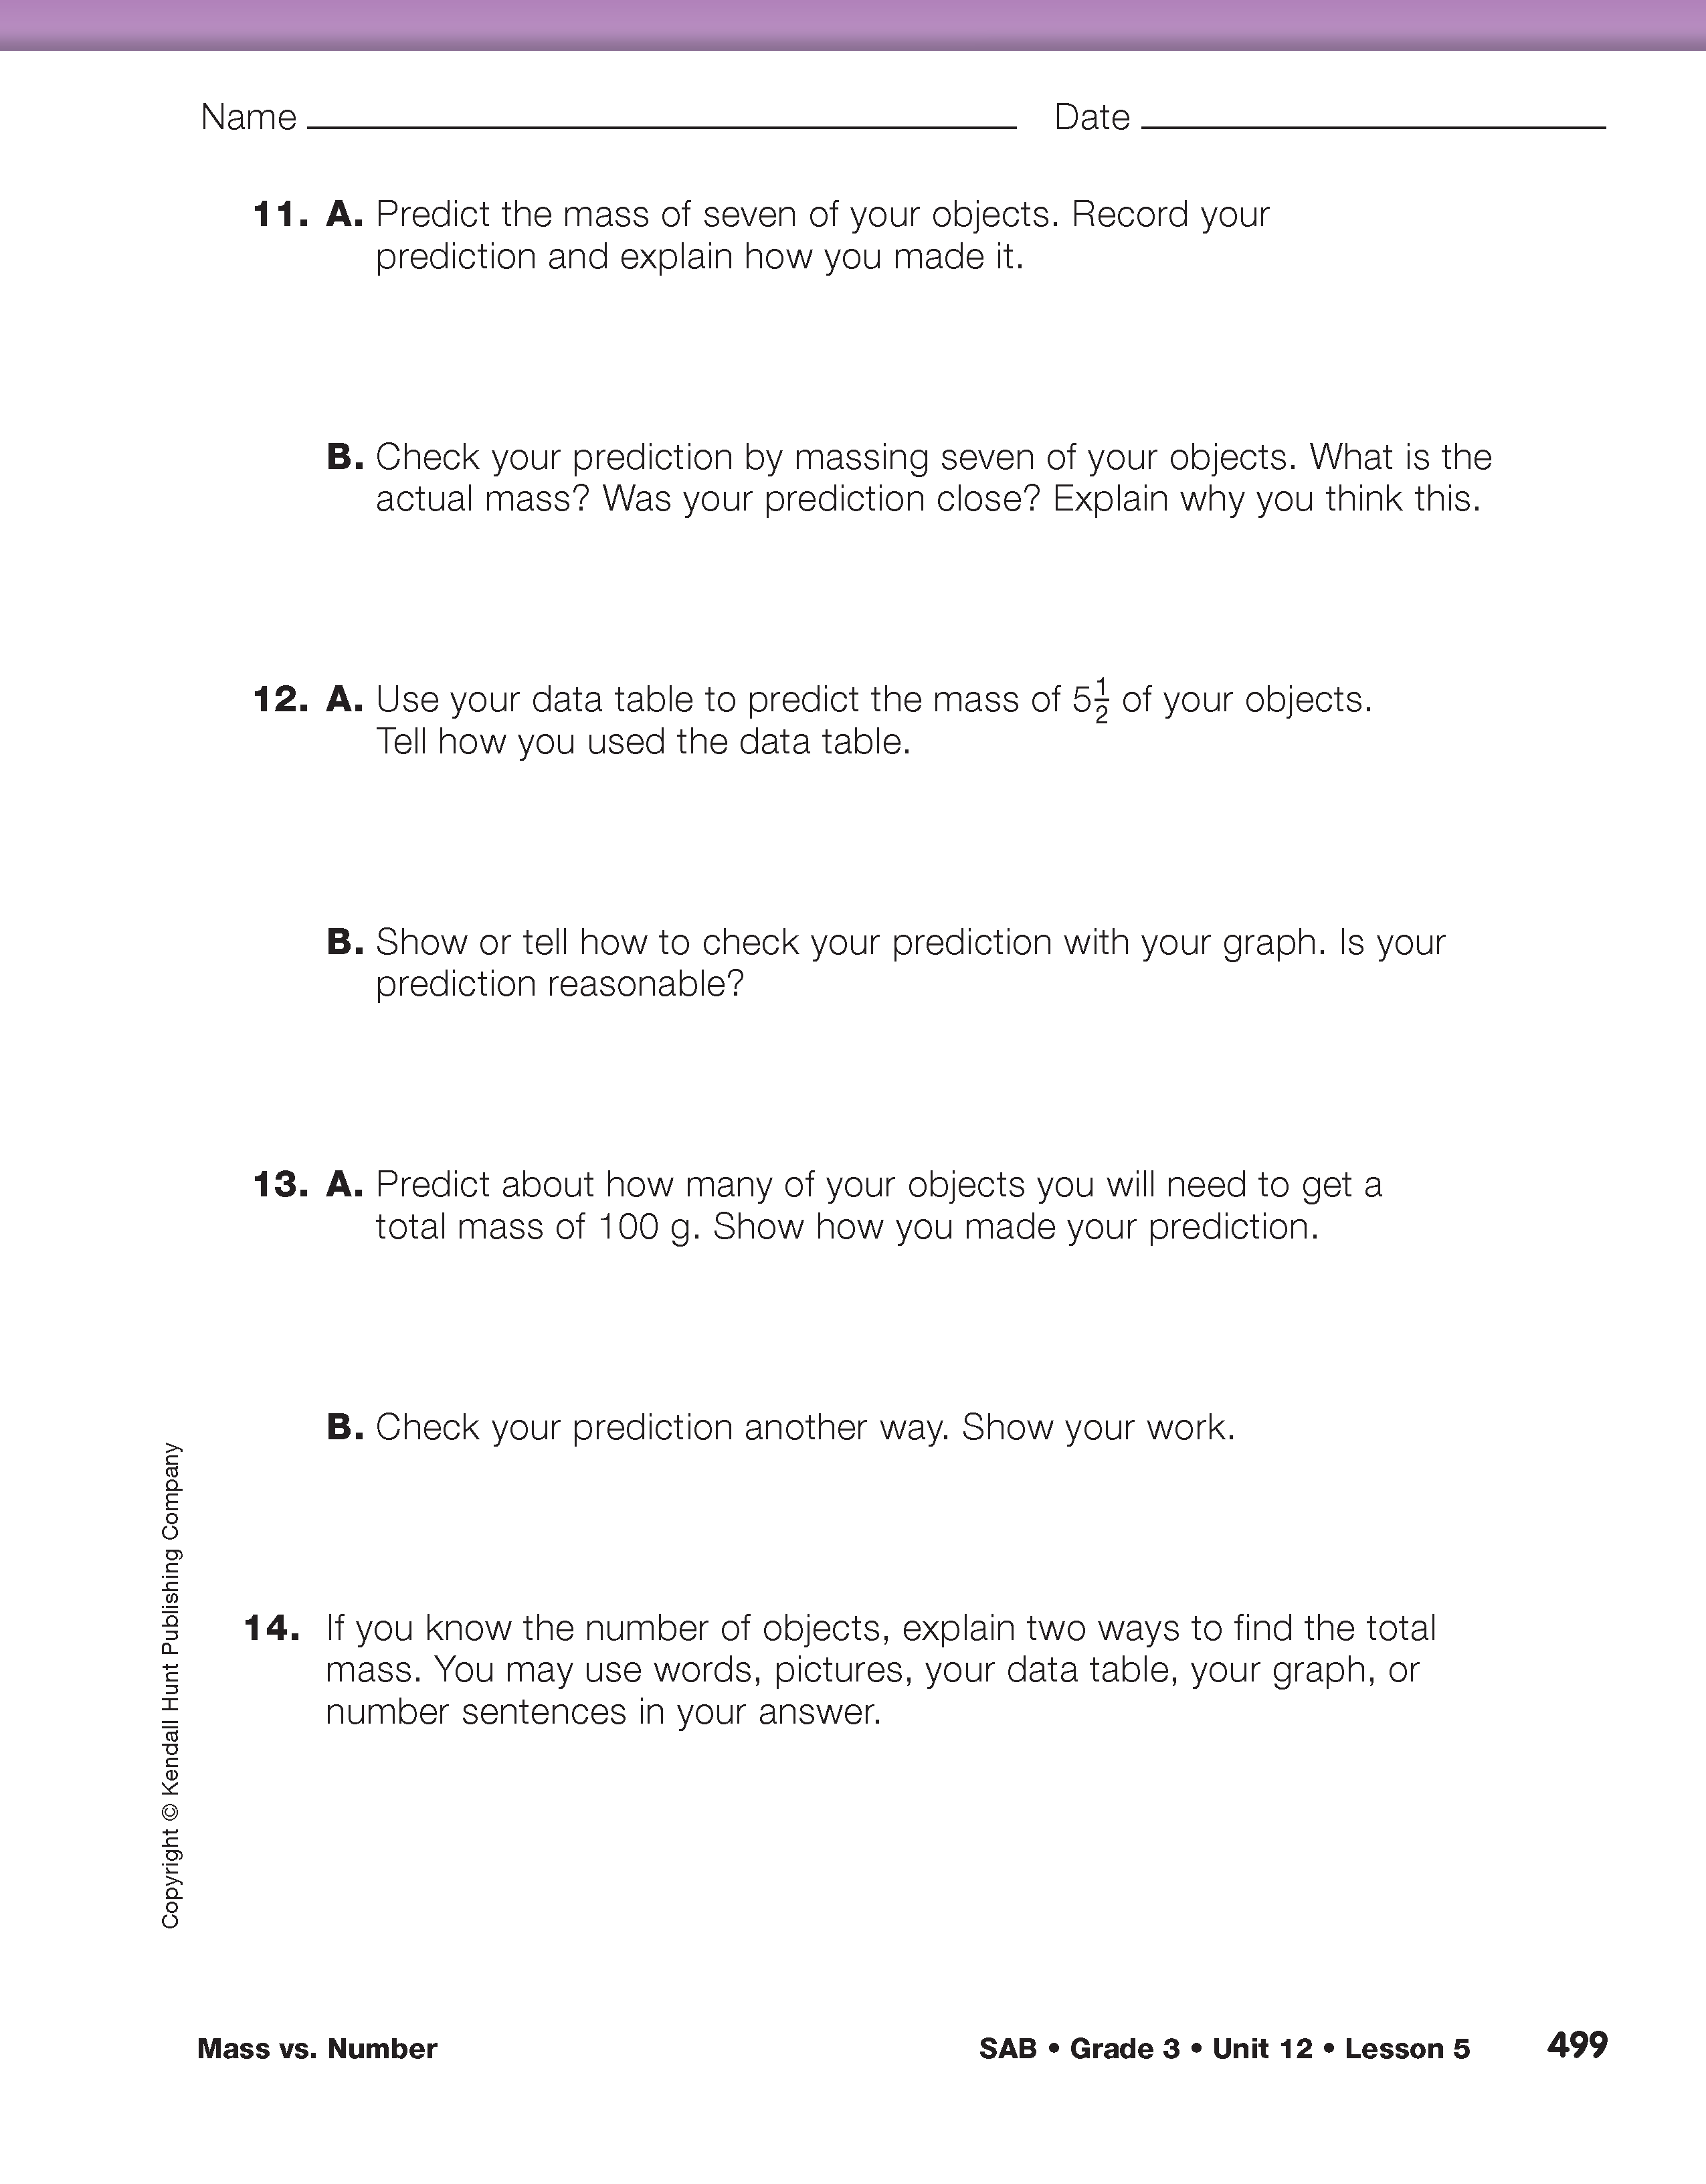
If the objects are almost identical, the data points will fall so close to a straight line that your students will probably not be able to tell the difference. Students should draw a best-fit line, a line that comes as close to fitting the data points as possible. They will use this line to make predictions. See TIMS Tip. Assign Questions 9–14. Students use their data to predict the mass for numbers of objects they have not found.
If the data is not reasonably close to a straight line, there is probably a mistake in either labeling the axes, plotting the data, or finding the mass. This is not measurement error but rather a mistake. Have students look for their mistakes by identifying the problem data.