


P. What's for Lunch 

Mr. Moreno's class went on a field trip to the museum. They ate lunch in the museum cafeteria. Shannon collected the following data about what her classmates ate for lunch. You will need a piece of graph paper.
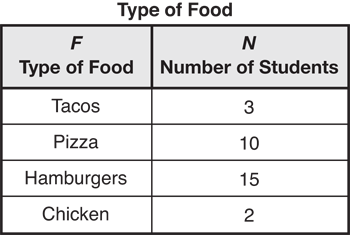
- Make a bar graph of Shannon's data on Centimeter Grid Paper.
- What variable did you graph on the horizontal axis? ______________
- Is that variable categorical or numerical? ______________
- What variable did you graph on the vertical axis? ______________
- Is that variable categorical or numerical? ______________
- What are some questions you could answer using the graph?