


Eyelets Lab
Est. Class Sessions: 3–4Developing the Lesson
Part 2. Investigate Eyelets
Review the TIMS Laboratory Method. The Eyelets Lab gives an overview of the TIMS Laboratory Method. This method has four phases:
- Draw
- Collect
- Graph
- Explore
Each of these phases is discussed in the Eyelets section of the Eyelets Lab pages in the Student Guide.
Before using the Student Guide, ask students questions that prompt them to share what they know about the TIMS Laboratory method.

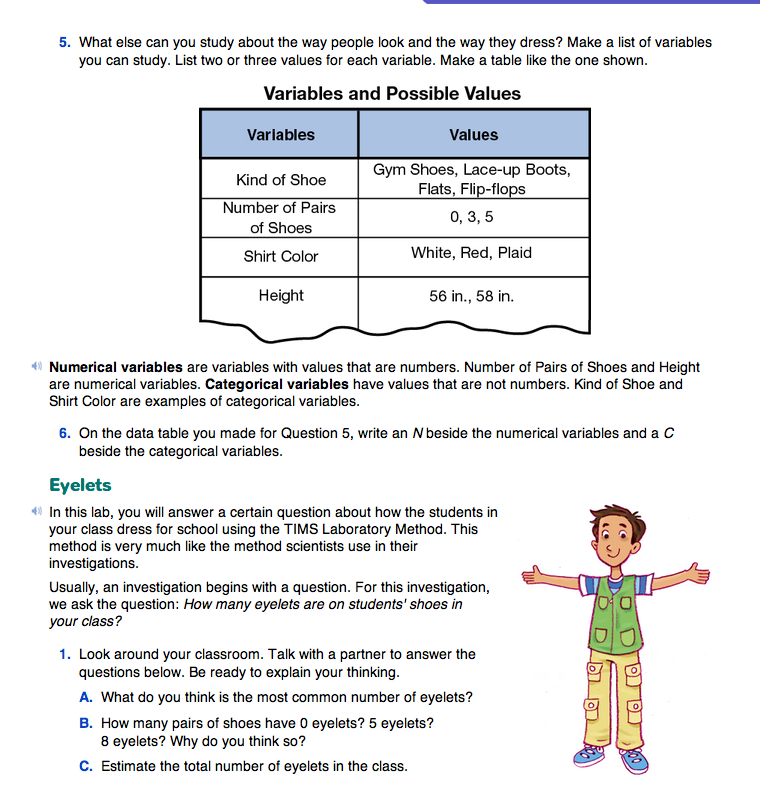
Ask the Investigate Question. The lab begins with a question: How many eyelets are on students' shoes in your class? The key variables related to this question are the Number of Eyelets (E) on a pair of shoes and the Number of Pairs of Shoes (P). The lab is an attempt to discover the relationship between these two variables.
Discuss the exact meaning of “the number of eyelets on a pair of shoes” with your students. In writing the lesson, we define an eyelet as one of the little holes meant for a shoelace. This hole may or may not have metal borders.
To clarify the definition of eyelets for the class, ask:
Students should consider if the number of eyelets is the total number on both shoes. You may choose to use other definitions. However, the terms must be clearly defined at the outset, just as the rules of a game must be agreed upon before the game begins. Note that using our definition, the number of eyelets is always a multiple of 4. This result is the subject of Questions 12–13 in the Explore section of the lab.
The opening question itself—How many eyelets are on students' shoes in your class?—may also need to be clarified.
What is meant is a whole series of questions:
Another way to interpret the question is as a query about individual students; for example:
Although this information could be listed in a “raw data” table, our analysis does not focus on what any particular student is wearing. For this reason, we organize our data table and graph so that we can study patterns in the number of eyelets of the group as a whole.

To involve students in these questions, ask them to work with a partner to answer Question 7. Have them write down their answers so that they can compare them to the data they will collect.
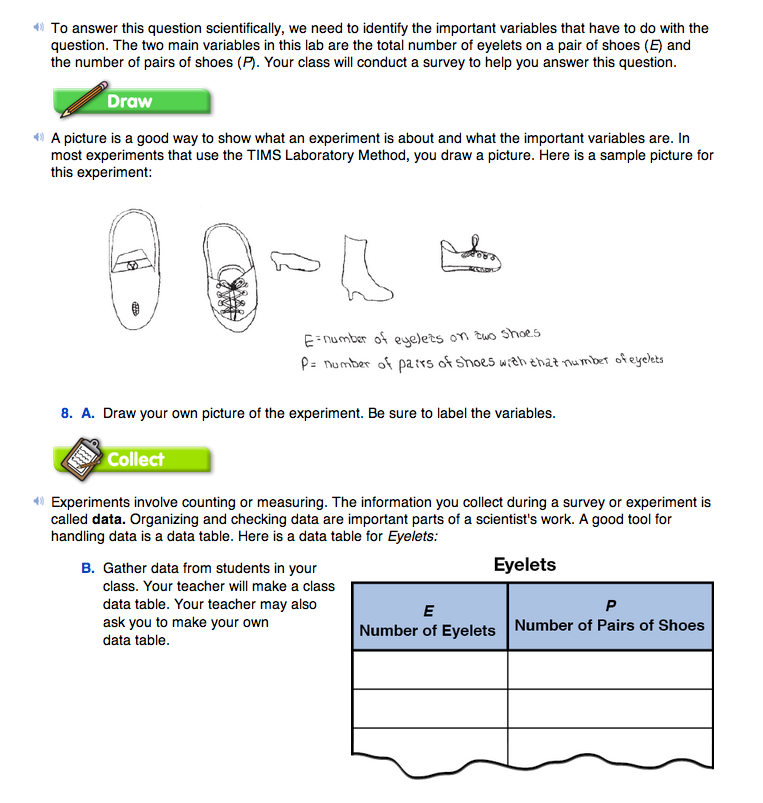
Draw. The work of beginning the investigation is summarized and communicated by a picture that shows the main variables and indicates the procedure. Draw an example picture on a blank display or have one or two students draw an example picture, as the class responds to the following questions.
Ask:
Point out that there are several ways to draw a picture of this investigation. Direct the students to the Student Guide and compare the sample picture with the class drawing. Next have students complete Question 8A using the Student Lab Packets. See Materials Preparation.

Collect. Before you begin gathering the data, draw a two-column data table on chat paper like the one in Figure 2. Setting up the data table with students provides an opportunity to review doubles.
Ask:
After this discussion, the left-hand column can be filled in with 0, 2, 4, etc. As part of the analysis of the investigation, students will find that listing the multiples of 4 would have been enough since there is an even number of eyelets on each of two shoes.
Once the data table is set up and students have counted all the eyelets on both their shoes, gather the data by asking for a show of hands for each value of the variable Number of Eyelets in the data table (E = 0, E = 2, E = 4, etc.).
When you have exceeded the maximum number of eyelets on one pair of shoes—which may be 40 or more—ask:
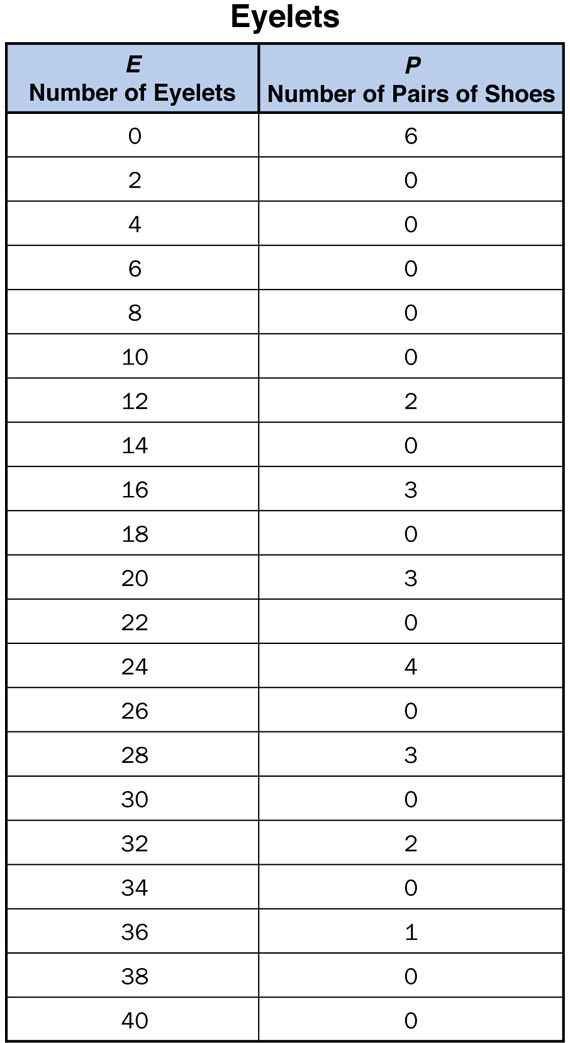
Once the class data table is complete, you may have students copy it (Question 8B). Figure 3 shows sample data for a Fifth Grade class.
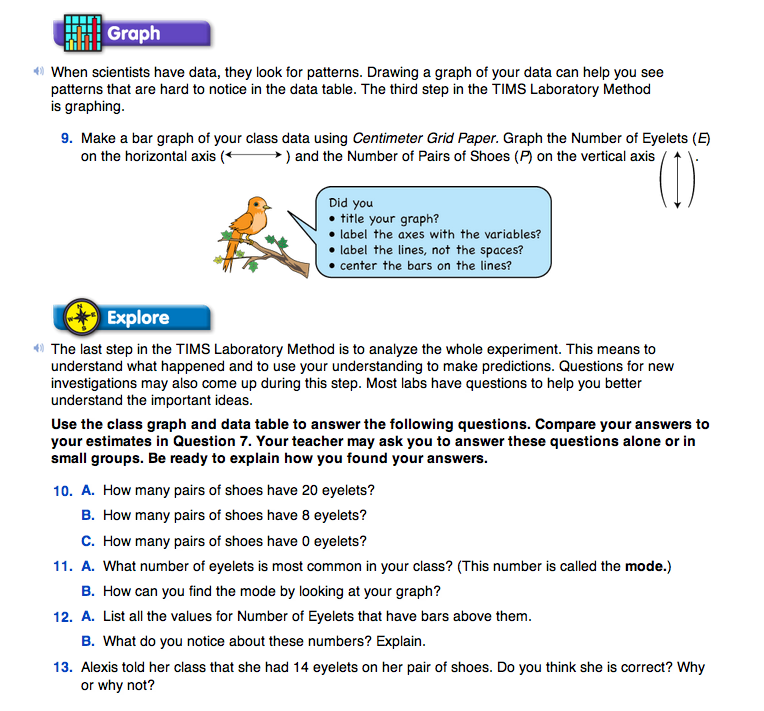
Graph.
Ask students to look at the data table and ask:
Help students see that a point graph is not necessary because it does not make sense to think about “in between” values for the number of eyelets (e.g., 2.5 eyelets). A bar graph is more appropriate for this data.
Use a display of the Centimeter Grid Paper Master to guide students as they label the graph. To better represent the data orient the grid paper as landscape.
Students will represent the class data in a bar graph for Question 9.
As students are completing their graphs ask:
Explore. The analysis of the lab is structured by Questions 10–19 in the Explore section of the Student Guide. As you discuss the questions, emphasize that the answers can often be found in more than one way. Encouraging multiple solutions lets all students participate in ways they understand.
For example, ask:
Write the students' solution paths and strategies on a display and identify each by the name of the student offering it.
Then ask:
Finding multiple solutions is facilitated by the multiple representations of the situation that have been developed in the lab: the shoes themselves, the data table, and the graph. On the other hand, solutions found by different methods should agree. If a graph shows that ten people have shoes with 24 eyelets and a data table shows that there are only 9 such people, then something is wrong.
Have students compare their estimated responses for Question 7A, 7B–C with the similar Questions 10, 11, and 17 posed after the experiment.
Ask:
To answer Questions 10A–10C, students can read the information directly from the data table or graph. For example, on the graph in Figure 4, the height of the bar above E = 20 eyelets shows us that 3 pairs of shoes have 20 eyelets. Similarly, 0 pairs of shoes have 8 eyelets and 6 pairs of shoes have 0 eyelets.
Question 11 introduces the term mode, a kind of average. The mode of a set of data is the most common value. In the sample data, the most common number of eyelets is 0. Six pairs of shoes have 0 eyelets. This is the largest number of pairs of shoes in the data table.
Ask:
In Question 12 students look for a pattern in the values of the variable Number of Eyelets. First, they list all the values for Number of Eyelets that have bars above them. In the sample data, these values are 0, 12, 16, 20, 24, 28, 32, and 36.
Ask:
Although they may describe these values as divisible by four or the “numbers you get when you skip count by four,” ask:
If a student has reported a value for Number of Eyelets that is not a multiple of four, ask him or her to recount the eyelets. Students apply this result in Question 13. Since 14 is not a multiple of four, Alexis cannot have 14 eyelets on her shoes.
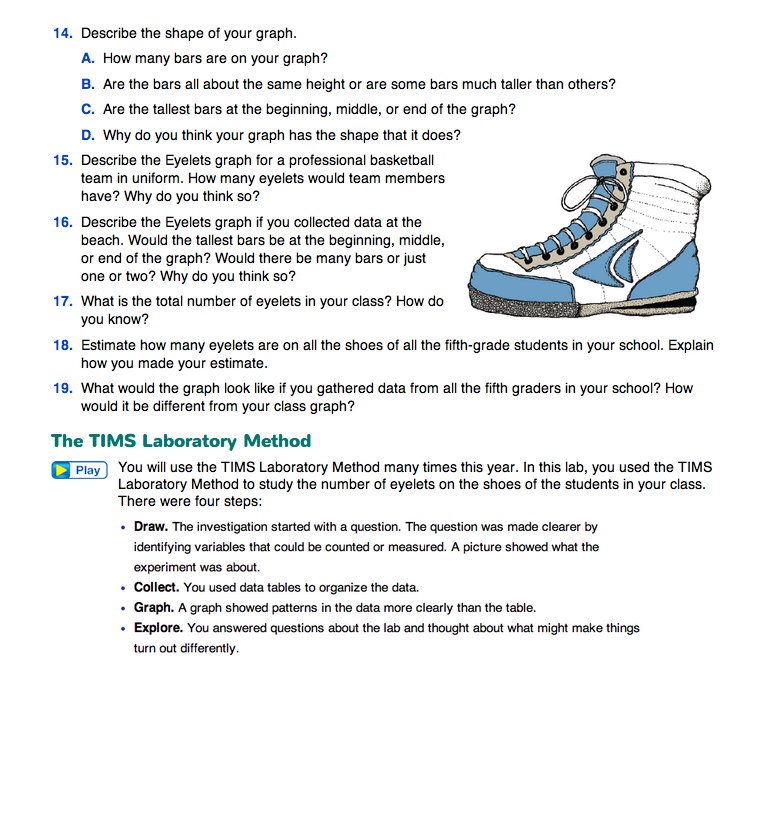
Question 14 asks students to describe the shape of the graph. The shape of the graph tells the “story of the data.” Parts A, B, and C guide the students in figuring out how to answer this question. To describe the graph in Figure 4, they can say that there are 8 bars on the graph that are not all the same height. The tallest bar is to the left on the graph (for the smallest number of eyelets). There are several numbers that have no bars. The rest of the bars look like a hill gradually getting taller, then smaller.
As in Question 14D, ask students:
Answers will vary based on your class data. For example, if your school has uniforms or a requirement that students wear particular types of shoes, then there may be only one or two bars on the graph for the number of eyelets for that type of shoe. However, if students can choose the type of shoes they wear, the data will be more spread out.
Questions 15–16 ask students to predict the shape of an Eyelets graph for different populations and to explain how they arrived at their prediction. For example, professional basketball players wear athletic shoes (Question 15). Since most of the players will wear the same kind of shoe, there will probably be fewer bars on the graph. Since the shoes will have lots of eyelets, the bars to the right on the graph will be tall. There will not be any bars on the left of the graph.
There are many strategies for finding the total number of eyelets on all the shoes of all the students in the class (Question 17). One possible strategy is to use a calculator to first multiply each number of eyelets by the corresponding number of pairs of shoes (the height of the bar for that number of eyelets). Then, sum the products as shown here for the sample data: 0 × 6 + 12 × 2 + 16 × 3 + 20 × 3 + 24 × 4 + 28 × 3 + 32 × 2 + 36 × 1 = 412 eyelets. Although strategies may vary, there is only one correct solution.

However, reasonable estimates and strategies may vary for Question 18. Students are to estimate the number of eyelets on all the shoes on all the fifth-graders in the school. One solution for a school with four fifth-grade classrooms might indicate that since there are about 400 eyelets in one classroom, the number of eyelets in the fifth grade is about 4 × 400 or 1600 eyelets. Encourage students to share their solutions and strategies with one another. Compare strategies and have students discuss the differences and similarities.
Ask questions such as: