Ask students to read the vignette in the Using Averages to Answer Question pages in the Student Guide that describes how Mr. Moreno's class used data to answer a “big question.” Discuss how Mr. Moreno needed to decide what data to gather in order to answer a question that he had.
- What question is Mr. Moreno trying to answer? For what purpose? (He wants to know how many books students read last week so that he can make a good estimate of the number of books he will need for the book club.)
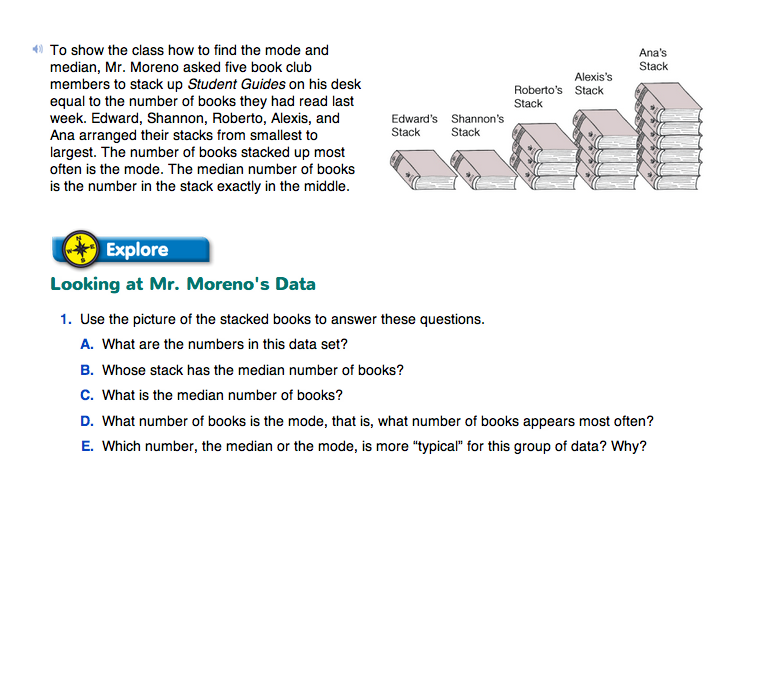
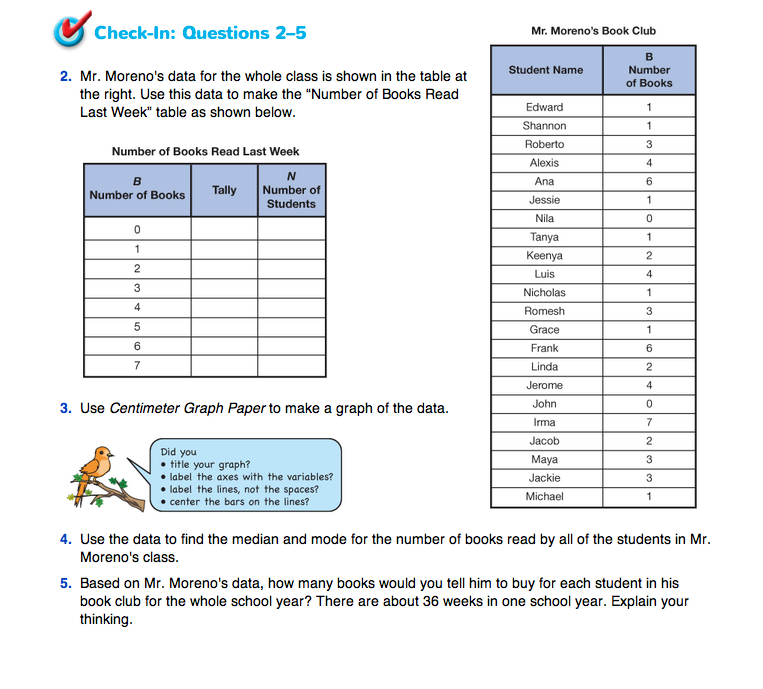
Ask students to answer Question 1 in small groups or pairs and then complete Check-In: Questions 2–5 independently. These questions explore median and mode and how to use median and mode to make predictions. Each student will need to make a three-column data table and will need a copy of the Centimeter Grid Paper Master.

- To complete the graph in Question 3, some students may need to be reminded to:
- Label the axes with the names of the variables;
- Label the lines, not the spaces, when they scale both the horizontal and vertical axes;
- Draw their bars centered on the lines; and
- Give the graph a title.
- Allowing students to work through the problem with the support of other students helps them figure out what is important, articulate the differences between median and mode, and ask the needed questions to become proficient problem solvers.
- Provide students copies of the Three-Column Data Table Master to support students who need help organizing and drawing the data table.
- Some students may need some additional support with Question 5. On average, how many books did the members of the book club read last week? How do you know? On average, how many books would the members of the book club read in 2 weeks? 10 weeks? 36 weeks?

Use Check-In: Questions 2–5 from the Using Averages to Answer Questions page in the Student Guide with the corresponding Feedback Box in the Teacher Guide to assess students' abilities to make a bar graph using numerical data [E4]; find the median of a data set [E5]; find the mode of a data set [E6]; read a table or bar graph to find information about a data set [E7]; model real-world situations with bar graphs [E8]; make predictions and generalizations about a data set using a median and mode [E9]; make predictions and generalizations about a data set using a data table and graph [E10]; know the problem [MPE1]; show work [MPE5]; and use labels [MPE6].
To provide targeted practice with data analysis, have students create their own question, collect data, graph the data, and summarize their results in a paragraph. Place copies of the Centimeter Grid Paper along with example investigation questions in a center.