Lesson 2

Using Averages to Answer Questions

Est. Class Sessions: 2–3
X

Mathematical Standards

5.MD.A
Convert like measurement units within a given measurement system. (5.MD.A.1)

Standards for Mathematical Practice

MP1.
Make sense of problems and persevere in solving them.
MP2.
Reason quantitatively.
MP4.
Model with mathematics.
MP5.
Use appropriate tools strategically.

Students review how to use averages and graphs to answer questions about data. Students pose questions for investigation and define variables for study. They find the median and mode (averages) of data sets and use them to answer questions about the data.

Content in this Lesson

  • Selecting, collecting, and organizing data to answer a question.
  • Naming numerical variables to study [E1].
  • Making a bar graph [E4].
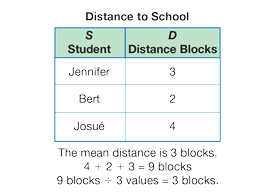
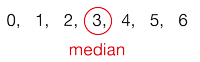
  • Finding the median of a data set [E5].
  • Finding the mode of a data set [E6].
  • Reading a table or bar graph to find information about a data set [E7].
  • Modeling real-world situations with bar graphs [E8].
  • Making predictions and generalizations about a data set using a data table, graph, median, and mode [E9, 10].
X

Materials for Students

Daily Practice and Problems Lesson Homework Assessment

Student Books

Student Guide

Teacher Resources

Teacher Guide - digital

Supplies for Students

  • self-adhesive notes
  • colored marker

Materials for the Teacher

Materials Preparation

Arrow on Self-Adhesive Note. Draw a single dark arrow on 3 or 4 adhesive notes. These adhesive notes will be used in Part 2 of the lesson to show the median number in a data set using a list, a graph, and a data table.

Prepare Optional Compare Populations Targeted Practice. Make a list of example investigation questions. Place the list and copies of the Centimeter Grid Paper Master in a center to provide targeted practice.

Assessment in this Lesson

Assessment Expectation Assessed Math Practices Expectation Assessed

Using Averages to Answer Questions
Check-In: Questions 2–5
Student Guide
Page 12
with corresponding Feedback Box
Teacher Guide - digital

E4.
Make a line plot or bar graph using numerical data.
E5.
Find the median of a data set.
E6.
Find the mode of a data set.
E7.
Read a table, line plot, or bar graph to find information about a data set.
E8.
Model real-world situations with tables, line plots, and bar graphs.
E9.
Make predictions and generalizations about a data set using a median and mode.
E10.
Make predictions and generalizations about a data set using a data table and graph.
MPE1.
Know the problem. I read the problem carefully. I know the questions to answer and what information is important.
MPE5.
Show my work. I show or tell how I arrived at my answer so someone else can understand my thinking.
MPE6.
Use labels. I use labels to show what numbers mean.