Students work individually or with a partner to complete Question 4–9 in the Reviewing Averages section of the Student Guide. These questions provide practice finding the median of data sets with both odd and even numbers and review finding the mode. Students also make decisions on the appropriate use of averages to represent a data set.
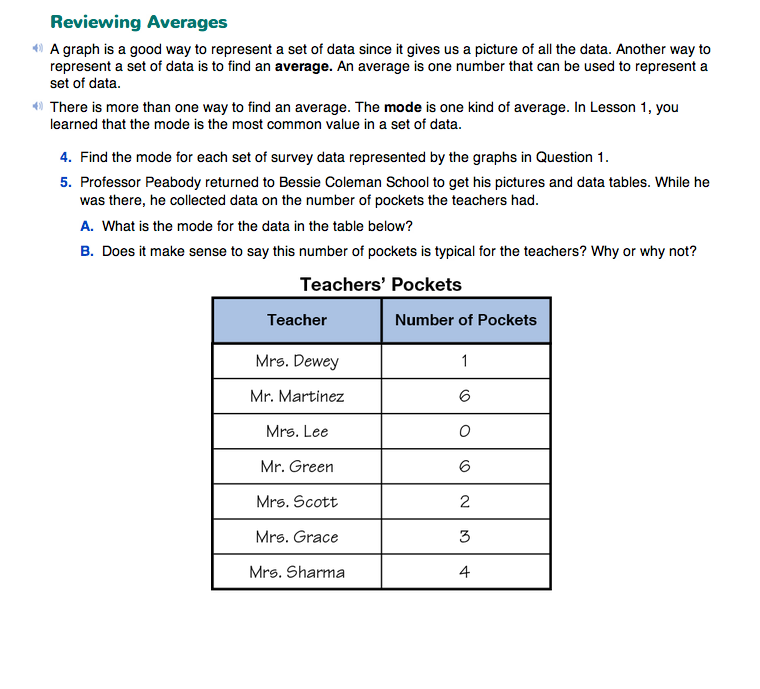
In Question 5A, students identify the mode as 6 pockets, since 6 is the most common value in the table (it occurs twice). Question 5B asks if it makes sense to say that 6 pockets is typical for the teachers. Have students explain their answers. Since the values range from 0 pockets to 6 pockets and most of the teachers have less than 5 pockets, 6 pockets does not do a very good job of representing the data.
Question 5 is followed by an explanation of the procedure for finding the median number of pockets. Since 3 is exactly in the middle of the data, 3 pockets is the median value.
- How can you find which number is the median in a data set? (Possible responses: The median is the number 3 because it has three data points on each side of it. It is exactly in the middle. If you line all of the numbers up in order, you can match them up starting at each end. For example, you can match the 0 and 6; 1 and 6; 2 and 4 and then you are left with 3 in the middle.)
Question 6 asks which average, the median or the mode, represents the data better.
- How did you decide whether the median or the mode was the best average to represent the data? (Possible response: The mode is not the best average to use because even though it is the most common data point, all of the other data points are less than 6. The median is a better average to use because it is more typical of the complete data set because there are values that are larger and smaller.)
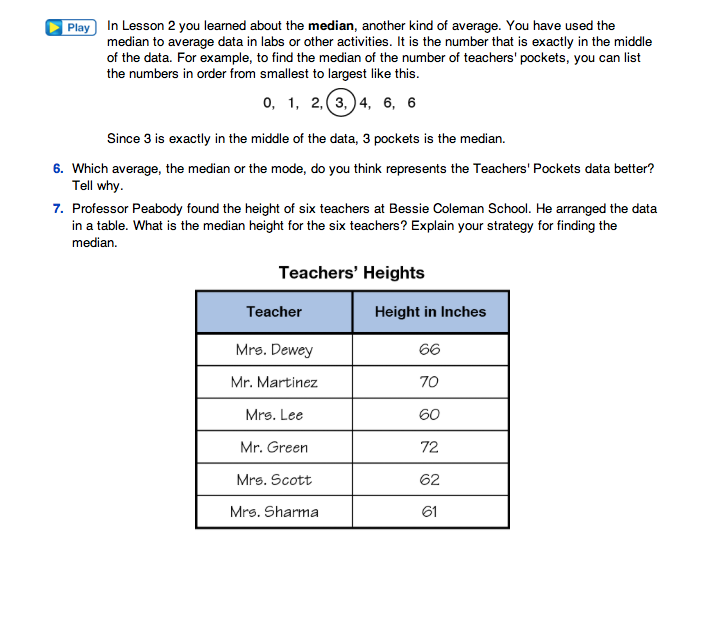
Ask students to look at the data displayed in the Teachers' Heights data table in Question 7. Invite students to share strategies they would use to find the median of a data set with an even number of data entries.
- When you have an uneven number of data entries you can find the median by finding the middle data point. How do you find the median when you have an even number of data entries? (Possible responses: When there is an even number of data entries you need to find the middle two numbers. Then you find the number that is between the two middle numbers.)
- What is the median for the data set of Teachers' Heights that Professor Peabody collected? (64 inches)
- What strategy did you use to find the median? (Possible response: 62 and 66 are the middle two numbers. The number between 62 and 66 is 64, so 64 inches is the median for this data.)
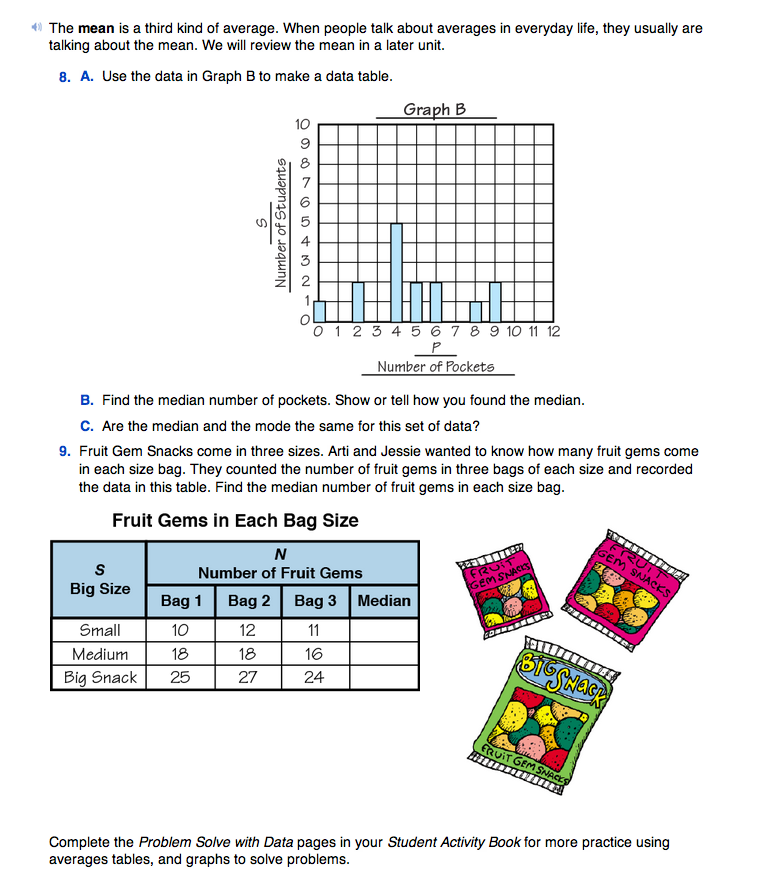
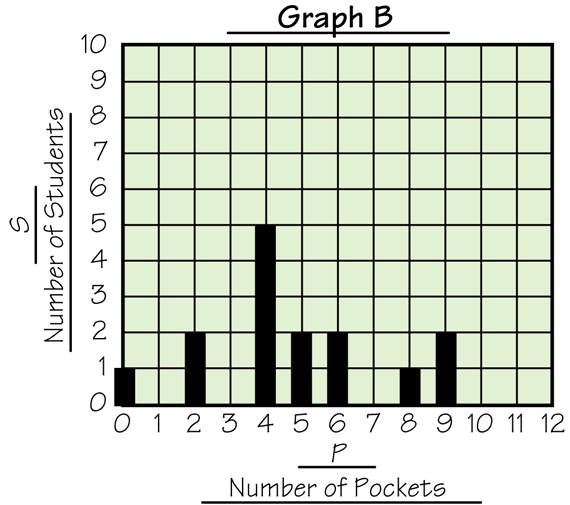
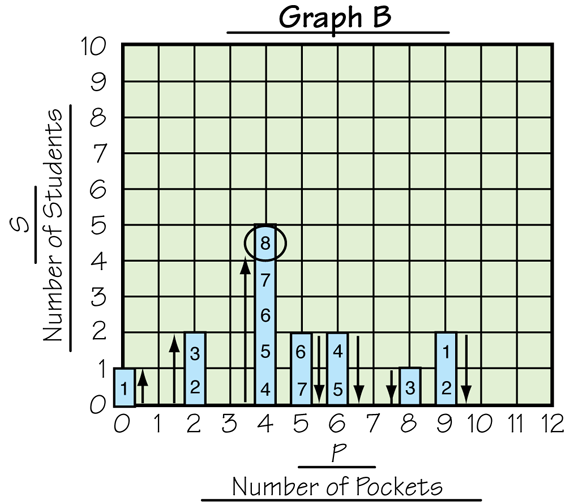
In Question 8A asks students make a data table of the data represented in Graph B in the Student Guide. This graph is shown in Figure 1.
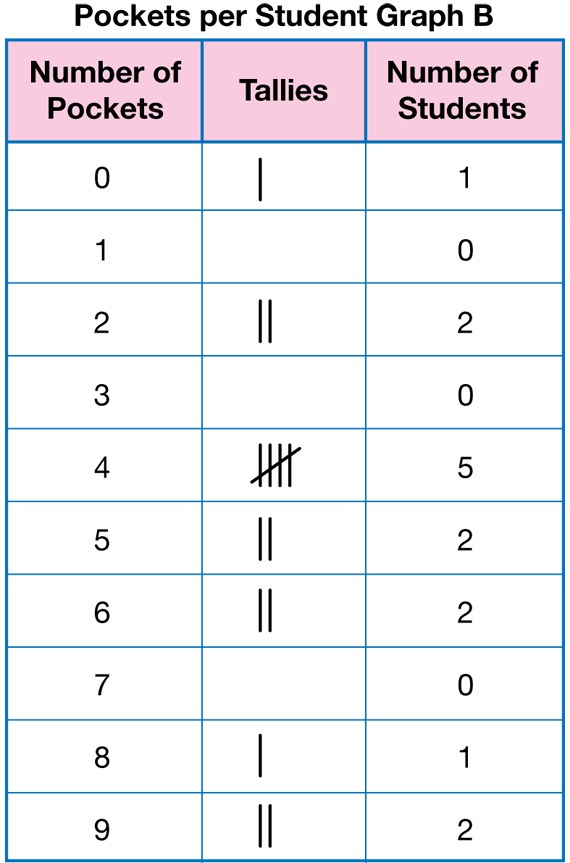
Students will need to think back to how the graph was constructed when they make their data tables. Encourage students to work together to make their tables. Figure 2 shows a completed table.
If a group has trouble getting started, work with those students using these or similar prompts.
- How will you set up your data table? How many columns will you have? (Possible response: My data table will have 2 columns. One column will be for the Number of Pockets and one will be for the Number of Students. Or, I am going to use a 3-column data table so I can use one column to make tally marks to show the height of each of the bars. The other two columns will be for Number of Pockets and Number of Students.)
- How did you decide what to use for the headings on your columns? What are the two variables represented on the graph? (Number of Pockets and Number of Students)
- What do the numbers on the horizontal axis tell you? (Number of Pockets)
- Where will you put these numbers in your data table? (in the first column)
- How many students have zero pockets? (one student) How do you know? (When you look at the graph the bar above the zero goes up to one on the vertical axis.)
- How will you record that one student has zero pockets on your data table? (Possible response: You record the one in the first row in the column for Number of Students.)
- How many students have 1 pocket? (No student has 1 pocket.) How do you know? (Possible response: There is no bar over the one for Number of Pockets.)
- Where will you record this on your data table? (I will record a zero in the second row under Number of Students.)
Continue asking these or similar questions until students are able to finish the data table independently.
Question 8B asks students to find the median of the data in Graph B. Students can use either the graph or the data table that they just constructed.
To help students think through this task, ask prompts similar to those below as appropriate:
- Can you estimate the median number of pockets for this data by looking at the graph or the data table? Remember that the median is the data point in the middle of the data. Where do you think the middle value is? (Answers will vary.)
- What are the smallest and largest number of pockets? How do you know? (Zero is the smallest number of pockets and 9 is the largest because the first bar is over the 0 and the last bar is over the 9.)
- If you look at the rest of the bars, where do you think the middle value will be? Why? (Possible response: Around 4 or 5 pockets because they are in the middle of 0 and 9 and there are bars over them.)
- How can you find the middle value exactly? (Answers will vary.)
- How have we found the median before? What did we do with all the values? (Possible response: We listed all the numbers from smallest to largest and then we found the one in the middle.)
- How can we use the graph or data table to list all the values?
- What does the first bar tell you on the graph? What does the first row of the data table tell you? (There is 1 student with 0 pockets.)
- What does that tell you to write down in your list? (We should write down one zero.)
- What does the second bar tell you? What does that tell you to write in your list? (That two people had two pockets, so we write two 2s.) [See Figure 3.]
- Where is the next bar? What does it tell you? What should you write in your list? (The next bar is over the 4. It says that 5 students have 4 pockets, so we should write five 4s in our list.)
Use the prompts to enable students to think through the process and continue on their own until they have a list as shown in Figure 3.
Students may have other methods and may be able to find the median by counting directly on the graph or table. See Figure 4.
After students have found the median for the data, ask them to point out where the median is on the graph.
- What do you notice about where the median is on the graph? (It's the same as the mode. It is on the tallest bar.)
- Does it look like it is in the middle? (Not really, it looks like there are more bars on the right side than on the left side.)
- Why do you think that happened? (We had to write a lot of 4s so they balanced out the bars on the right.)
- Was your estimate of the median number of pockets close?
Students complete Question 9 to practice finding the median number of fruit gems in each of three different-sized bags.
Students need graph paper which has at least 20 lines on one side to complete this graph. Copies of the Centimeter Grid Paper Master turned on its side will work.