Lesson 4

Searching the Forest

Est. Class Sessions: 4
X

Mathematical Standards

5.MD.A
Convert like measurement units within a given measurement system. (5.MD.A.1)

Standards for Mathematical Practice

MP1.
Make sense of problems and persevere in solving them.
MP2.
Reason quantitatively.
MP3.
Construct viable arguments and critique the reasoning of others.
MP4.
Model with mathematics.
MP5.
Use appropriate tools strategically.
MP6.
Attend to precision.
MP7.
Look for and make use of structure.

Students begin this lesson by reading and discussing the story “A Matter of Survival” in the Student Guide. This story uses the context of studying animals in the rain forest to introduce the technique of population sampling. Students then use a sampling technique to study the distribution of colors in a population of colored square-inch tiles. Students take several 10-tile samples from a bag containing 50 tiles. They record the number of tiles of each color, find the median number per sample of each color, graph the data, and analyze the results.

Content in this Lesson

  • Naming variables in an investigation [E1].
  • Representing the variables and procedures of an investigation with a drawing [E2].
  • Making a bar graph using categorical data [E3].
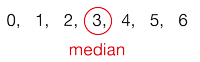
  • Finding the median of a data set [E5].
  • Reading a table or bar graph to to find information about a data set [E7].
  • Making predictions and generalizations about a data set using a data table, graph, and median [E9, 10].
  • Connecting mathematics and science to real-world situations using samples to make predictions about a population [E8].
X

Materials for Students

Daily Practice and Problems Lesson Homework Assessment

Student Books

Student Guide
Student Activity Book    

Teacher Resources

Teacher Guide - digital

Supplies for Student Groups

  • 50 square inch tiles, at least two colors
  • paper lunch bag or another small opaque bag
  • letter-size envelope

Materials for the Teacher

Materials Preparation

Gather Materials to “Populate the Forest.” Gather enough colored square-inch tiles so that each group will have at least 50 square-inch tiles in two or more colors. Other items that can be used in place of the square-inch tiles include: connecting cubes or links. Each group will also need a brown paper lunch bag and an envelope.

Assessment in this Lesson

Assessment Expectation Assessed Math Practices Expectation Assessed

Searching the Forest Lab
with Feedback Box
Student Activity Book
Pages 7–10

E1.
Name variables in an investigation and list appropriate values for each.
E2.
Represent variables and the procedures of an investigation with a drawing.
E3.
Make a bar graph using categorical data.
E5.
Find the median of a data set.
E7.
Read a table, line plot, or bar graph to find information about a data set.
E9.
Make predications and generalizations about a data set using a median and mode.
E10.
Make predications and generalizations about a data set using a data table and graph.
MPE1.
Know the problem. I read the problem carefully. I know the questions to answer and what information is important.
MPE2.
Find a strategy. I choose good tools and an efficient strategy for solving the problem.
MPE5.
Show my work. I show or tell how I arrived at my answer so someone else can understand my thinking.

Jocelyn's Wildflowers
with Feedback Box
Teacher Guide - digital

E3.
Make a bar graph using categorical data.
E5.
Find the median of a data set.
E8.
Model real-world situations with tables, line plots, and bar graphs.
E10.
Make predications and generalizations about a data set using a data table and graph.