Represent Data with Line Plots. Direct students to the Represent Data with Line Plots pages in the Student Guide. In the opening vignette Mr. Moreno introduces students to the use of line plots as a tool to represent data. A line plot is a quick, simple way to organize data. A line plot shows frequency of data along a number line. Ask students to read the vignette with a partner and complete Questions 1–5.
After students have had several minutes to work, ask:
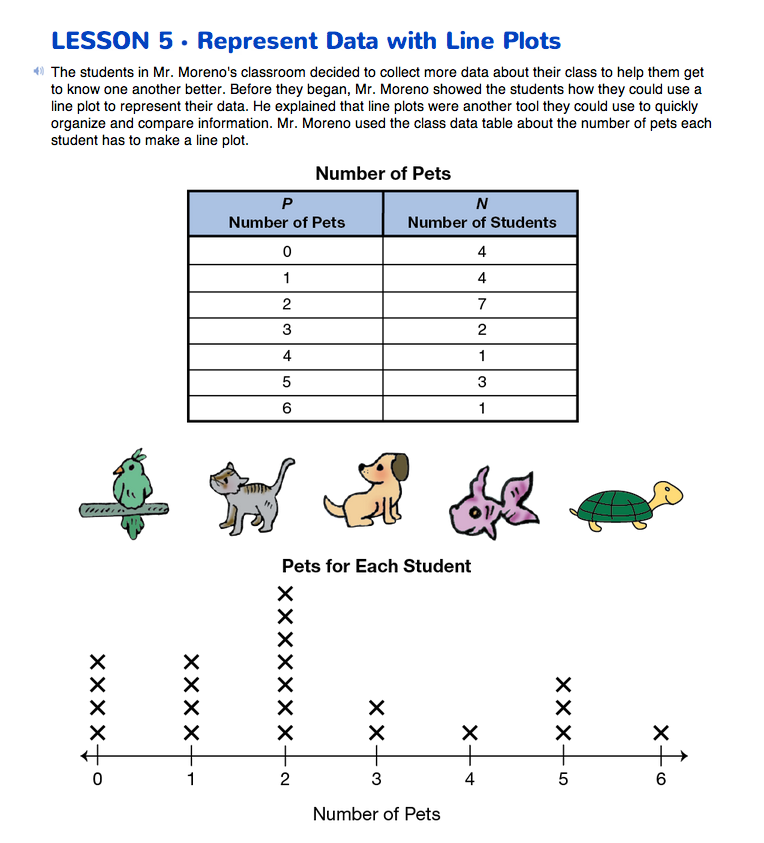
- How did the students in Mr. Moreno's classroom represent the variables in their investigation about pets using a line plot? (The numbers on the number line show the number of pets and the Xs show the number of students who have that many pets. For example, there are four Xs above the zero to show that four students have zero pets.)
- How can you use the line plot to identify the mode for the number of pets in Mr. Moreno's class? (Possible response: When you look at the line plot you can see that there are the most Xs above the two on the number line, so the mode for the number of pets is two.)
- What strategy can you use to find the median using the line plot? (Possible response: The median is the value in the middle of the data. To use the line plot you can count the Xs from each end until you get to the middle X. Since there are 22 Xs on this line plot the median will be the value between the eleventh and twelfth X. Both the eleventh and twelfth X show 2 pets, so the median number of pets is 2.)
- How did you use the line plot to find out how many students have 3 or fewer pets? (I counted the total number of Xs for zero, one, two and three pets.)
- How is the line plot similar to a bar graph? (The number line is like the horizontal axis of a bar graph. The Xs above each number are stacked like the bars on a bar graph.)
- How is the line plot different from a bar graph? (There is no vertical axis or scale. To find out the value of each stack of Xs you have to count the Xs.)
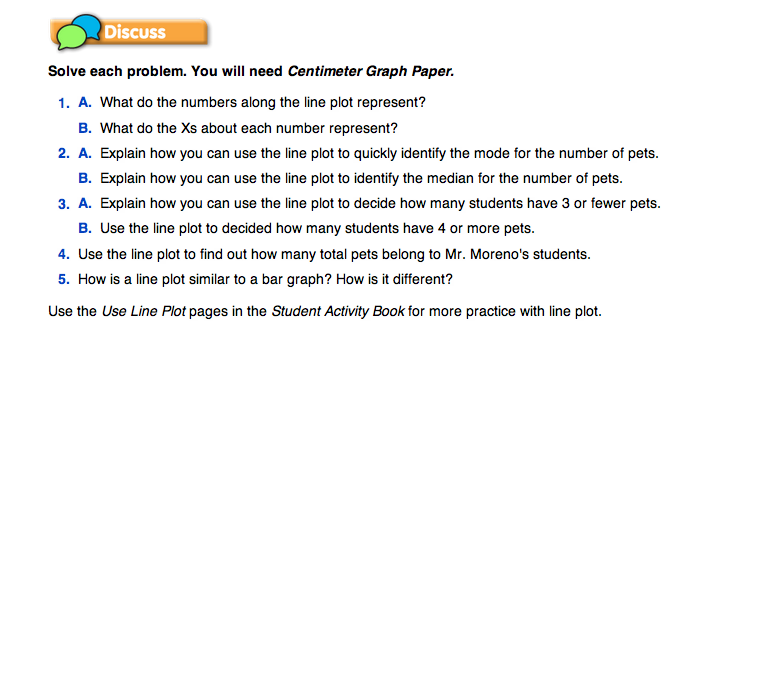
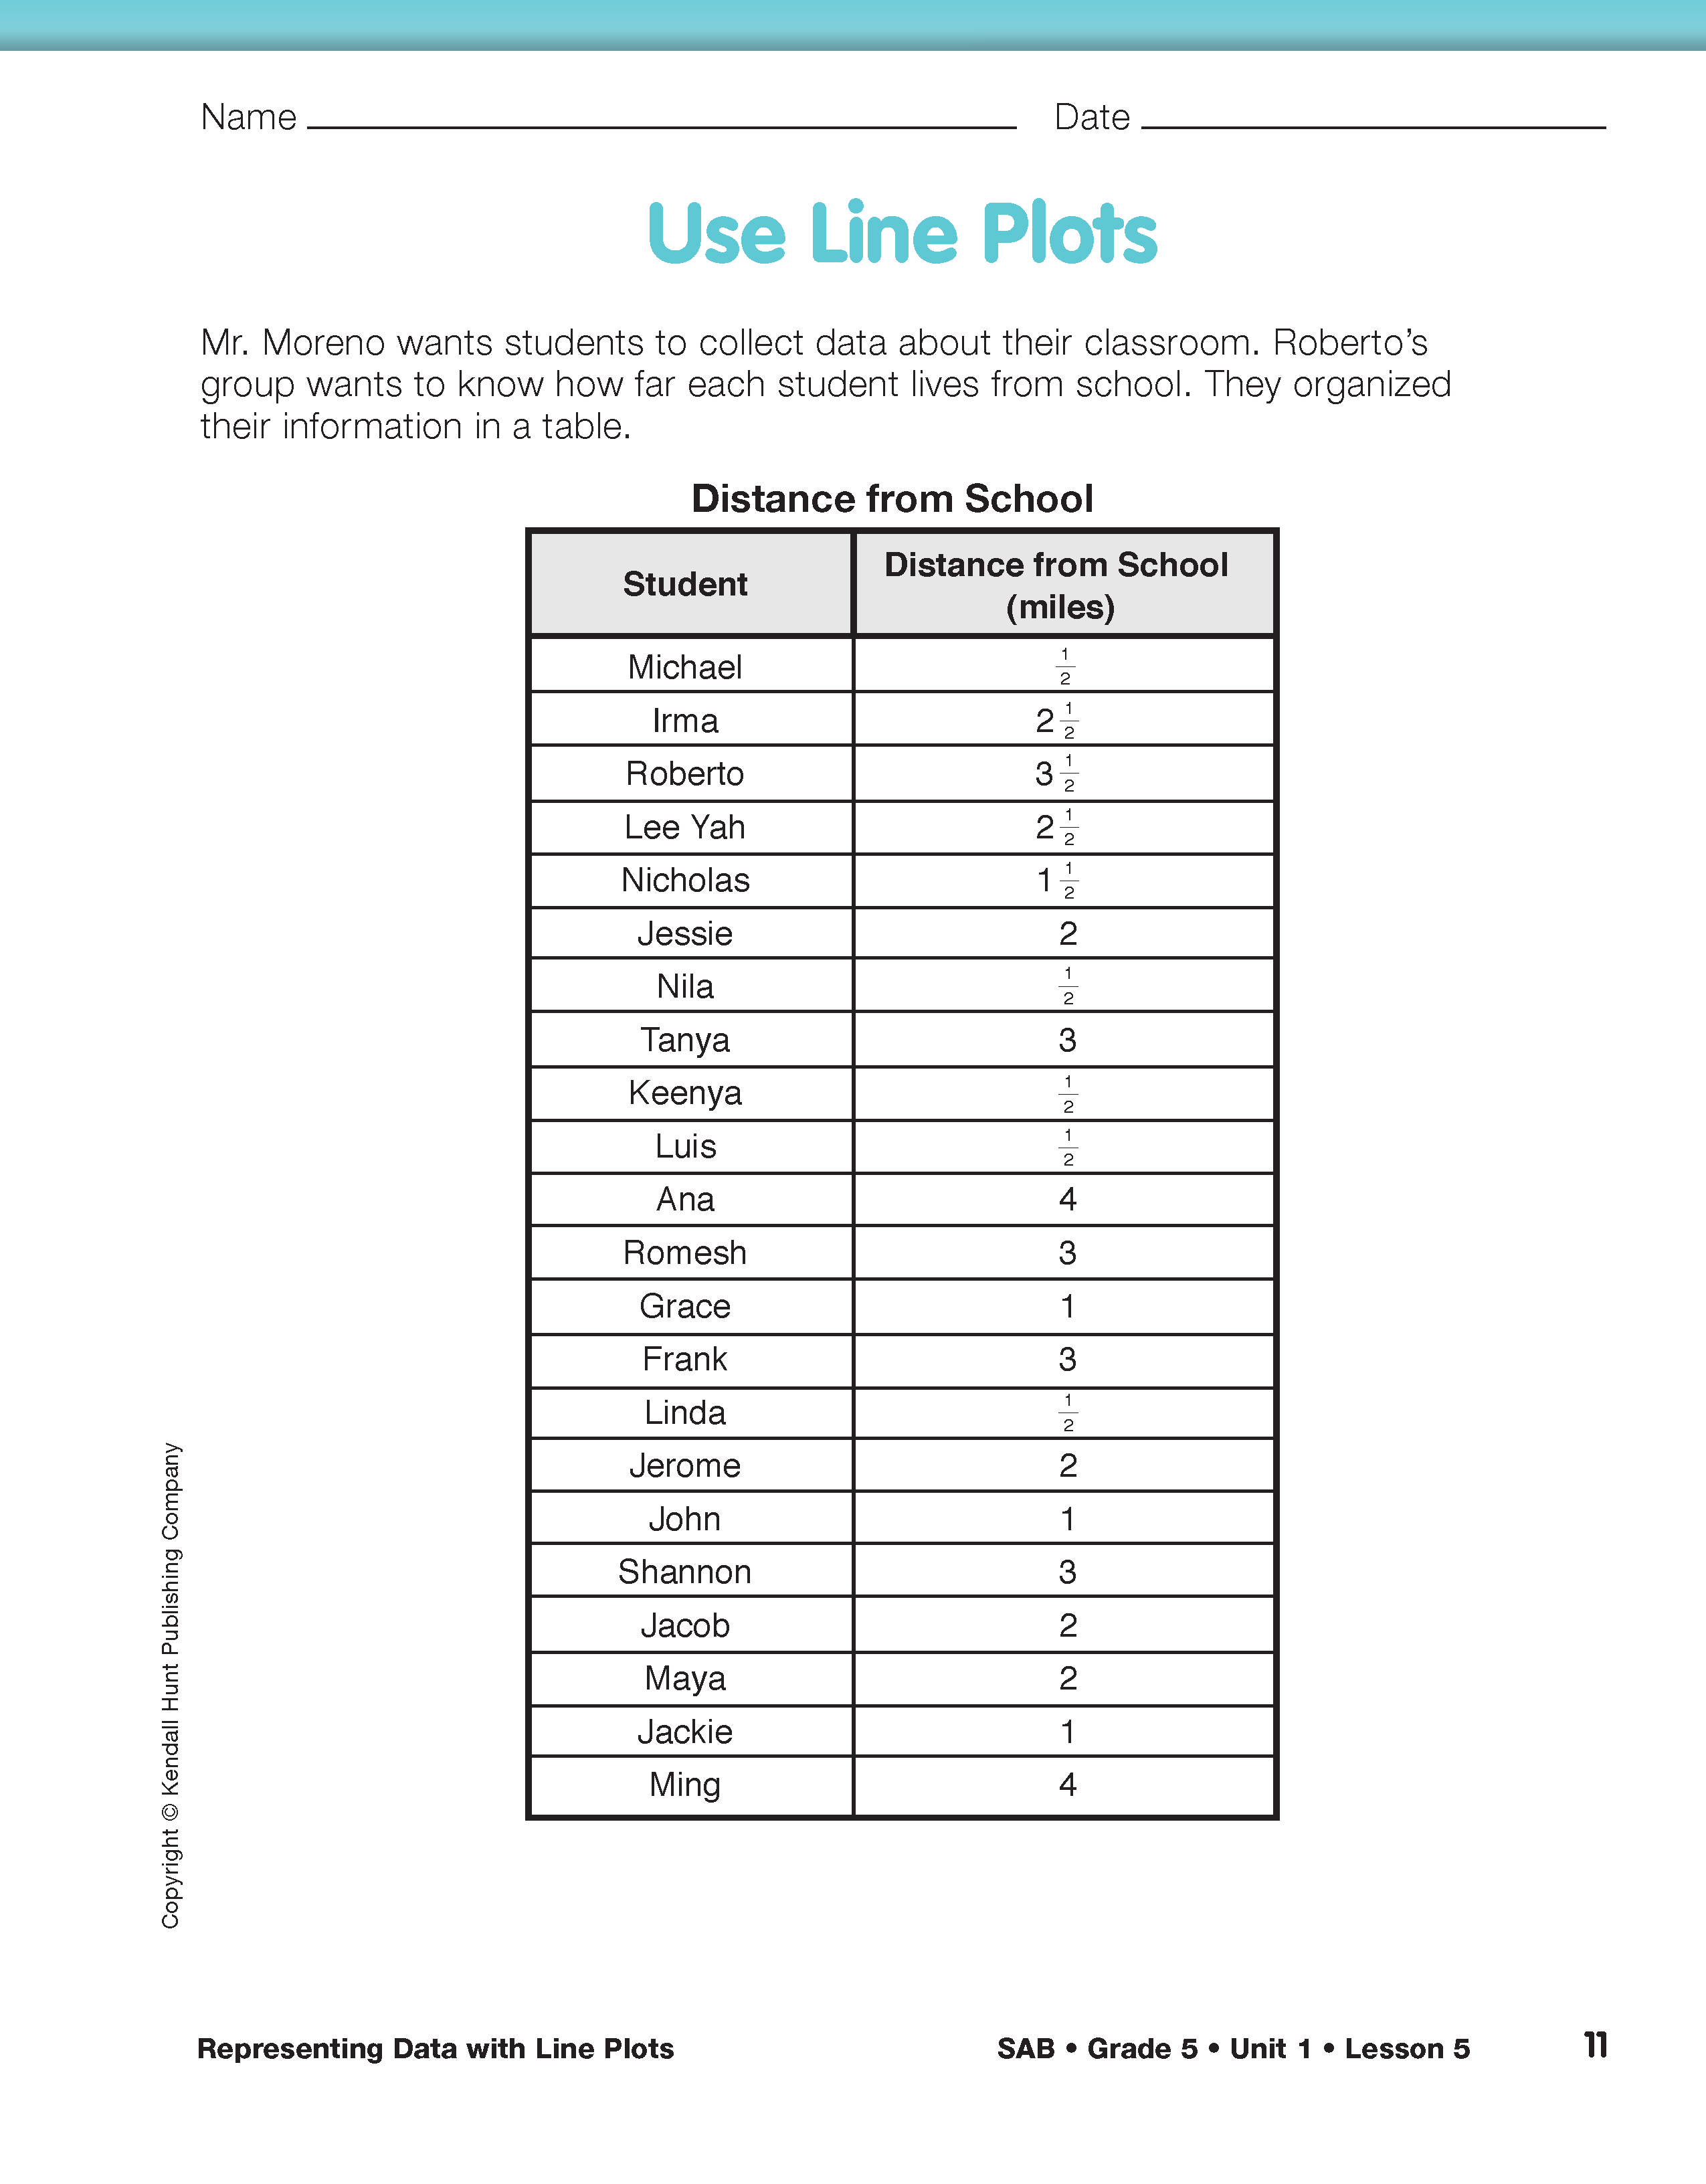
Direct students to the Use Line Plots pages in the Student Activity Book. Students can complete Questions 1–8 on these pages independently or with a partner. Questions 1–4 explore data collected about the distances students live from school. In Question 1, students are directed to reorganize the information collected in the survey into a data table.
- How can reorganizing the data into the three-column data table make it easier to work with the data? (Possible response: When the data is organized in the data table you can readily see the two variables: Distance from School and Number of Students. It is also easier to see how many students live each distance from school. When you reorganize the data into a data table you can organize the distances from school in order starting from 1/2 mile and going to 4 miles.)
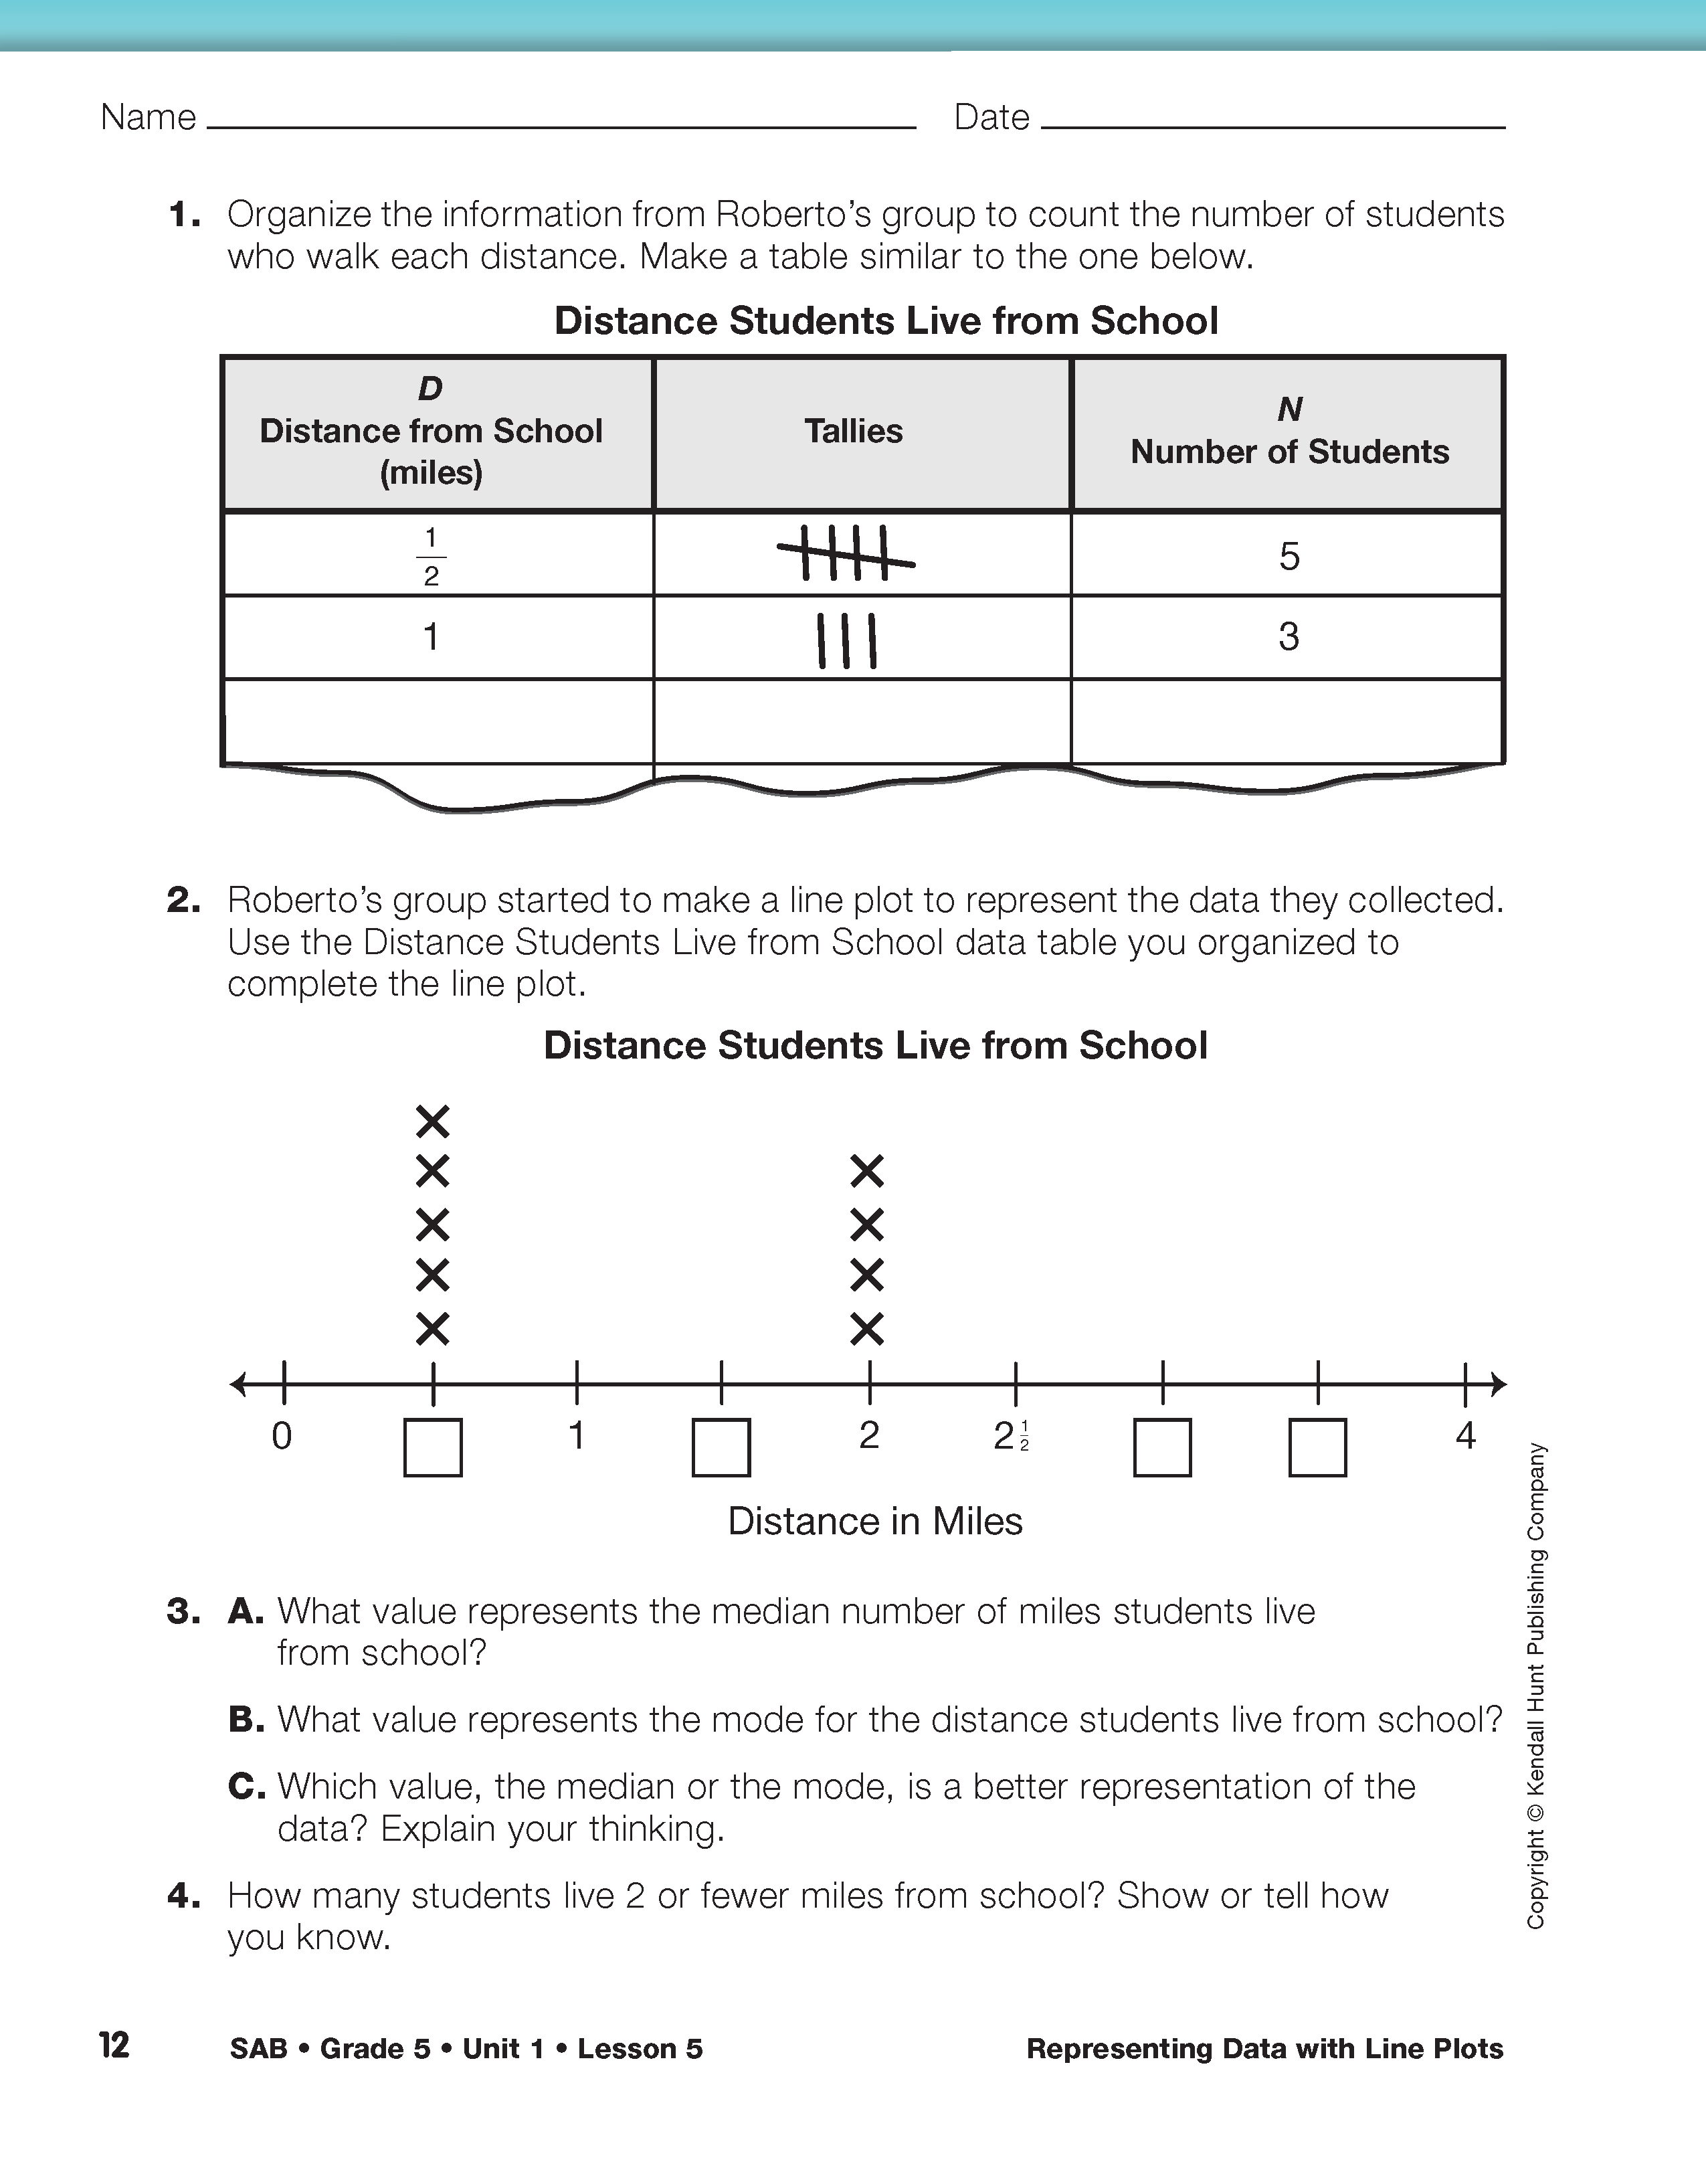
In Question 2, students complete a line plot representing the data for the distance students live from school. They then use the line plot to answer Questions 3–4.
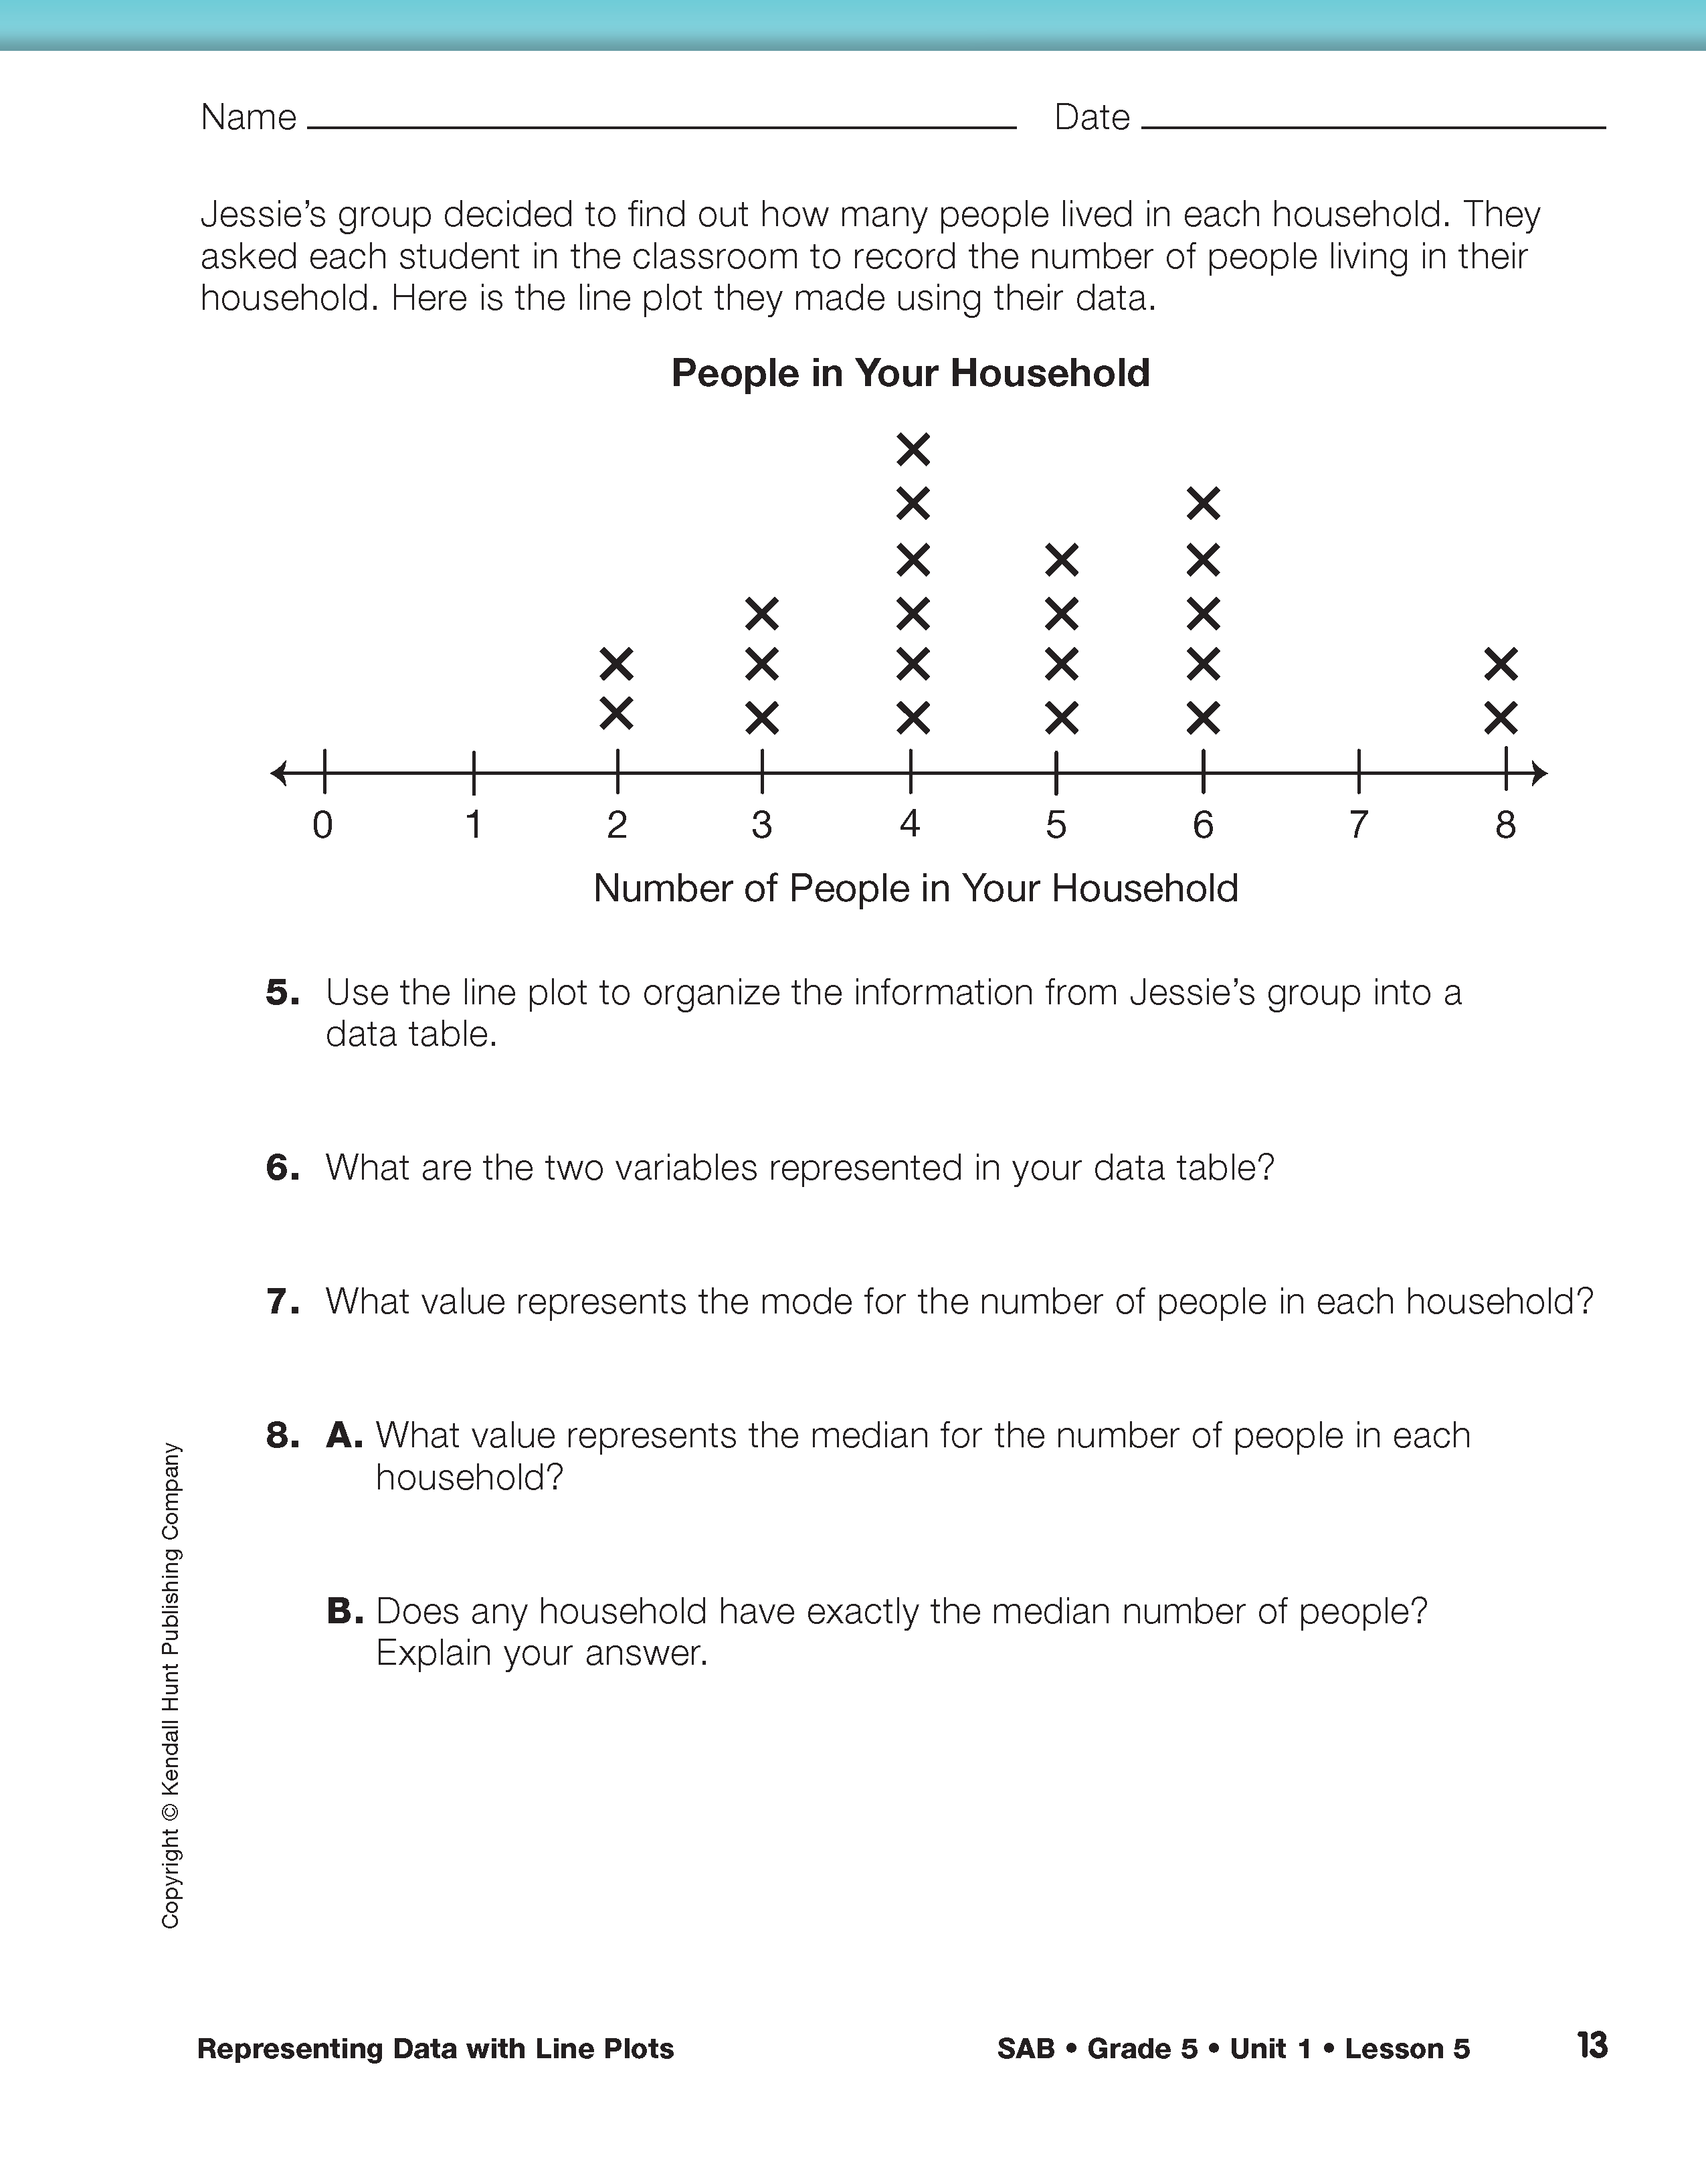
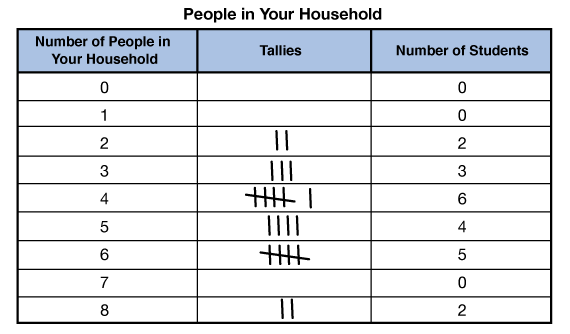
In Questions 5–8, students use data collected about the number of people in each household to answer questions. In Question 5, students use a line plot representing the data collected to create a data table. See Figure 1 for a completed data table.
Students can use the line plot and the data table to answer Questions 6–8. Students are asked to identify the median for the number of people in each household in Question 8A. Students should identify that the median is halfway between 4 family members and 5 family members, so the median family members per household is 41/2. For Question 8B, students should reason that no household could have exactly 41/2 people since it is not possible to have half of a person.
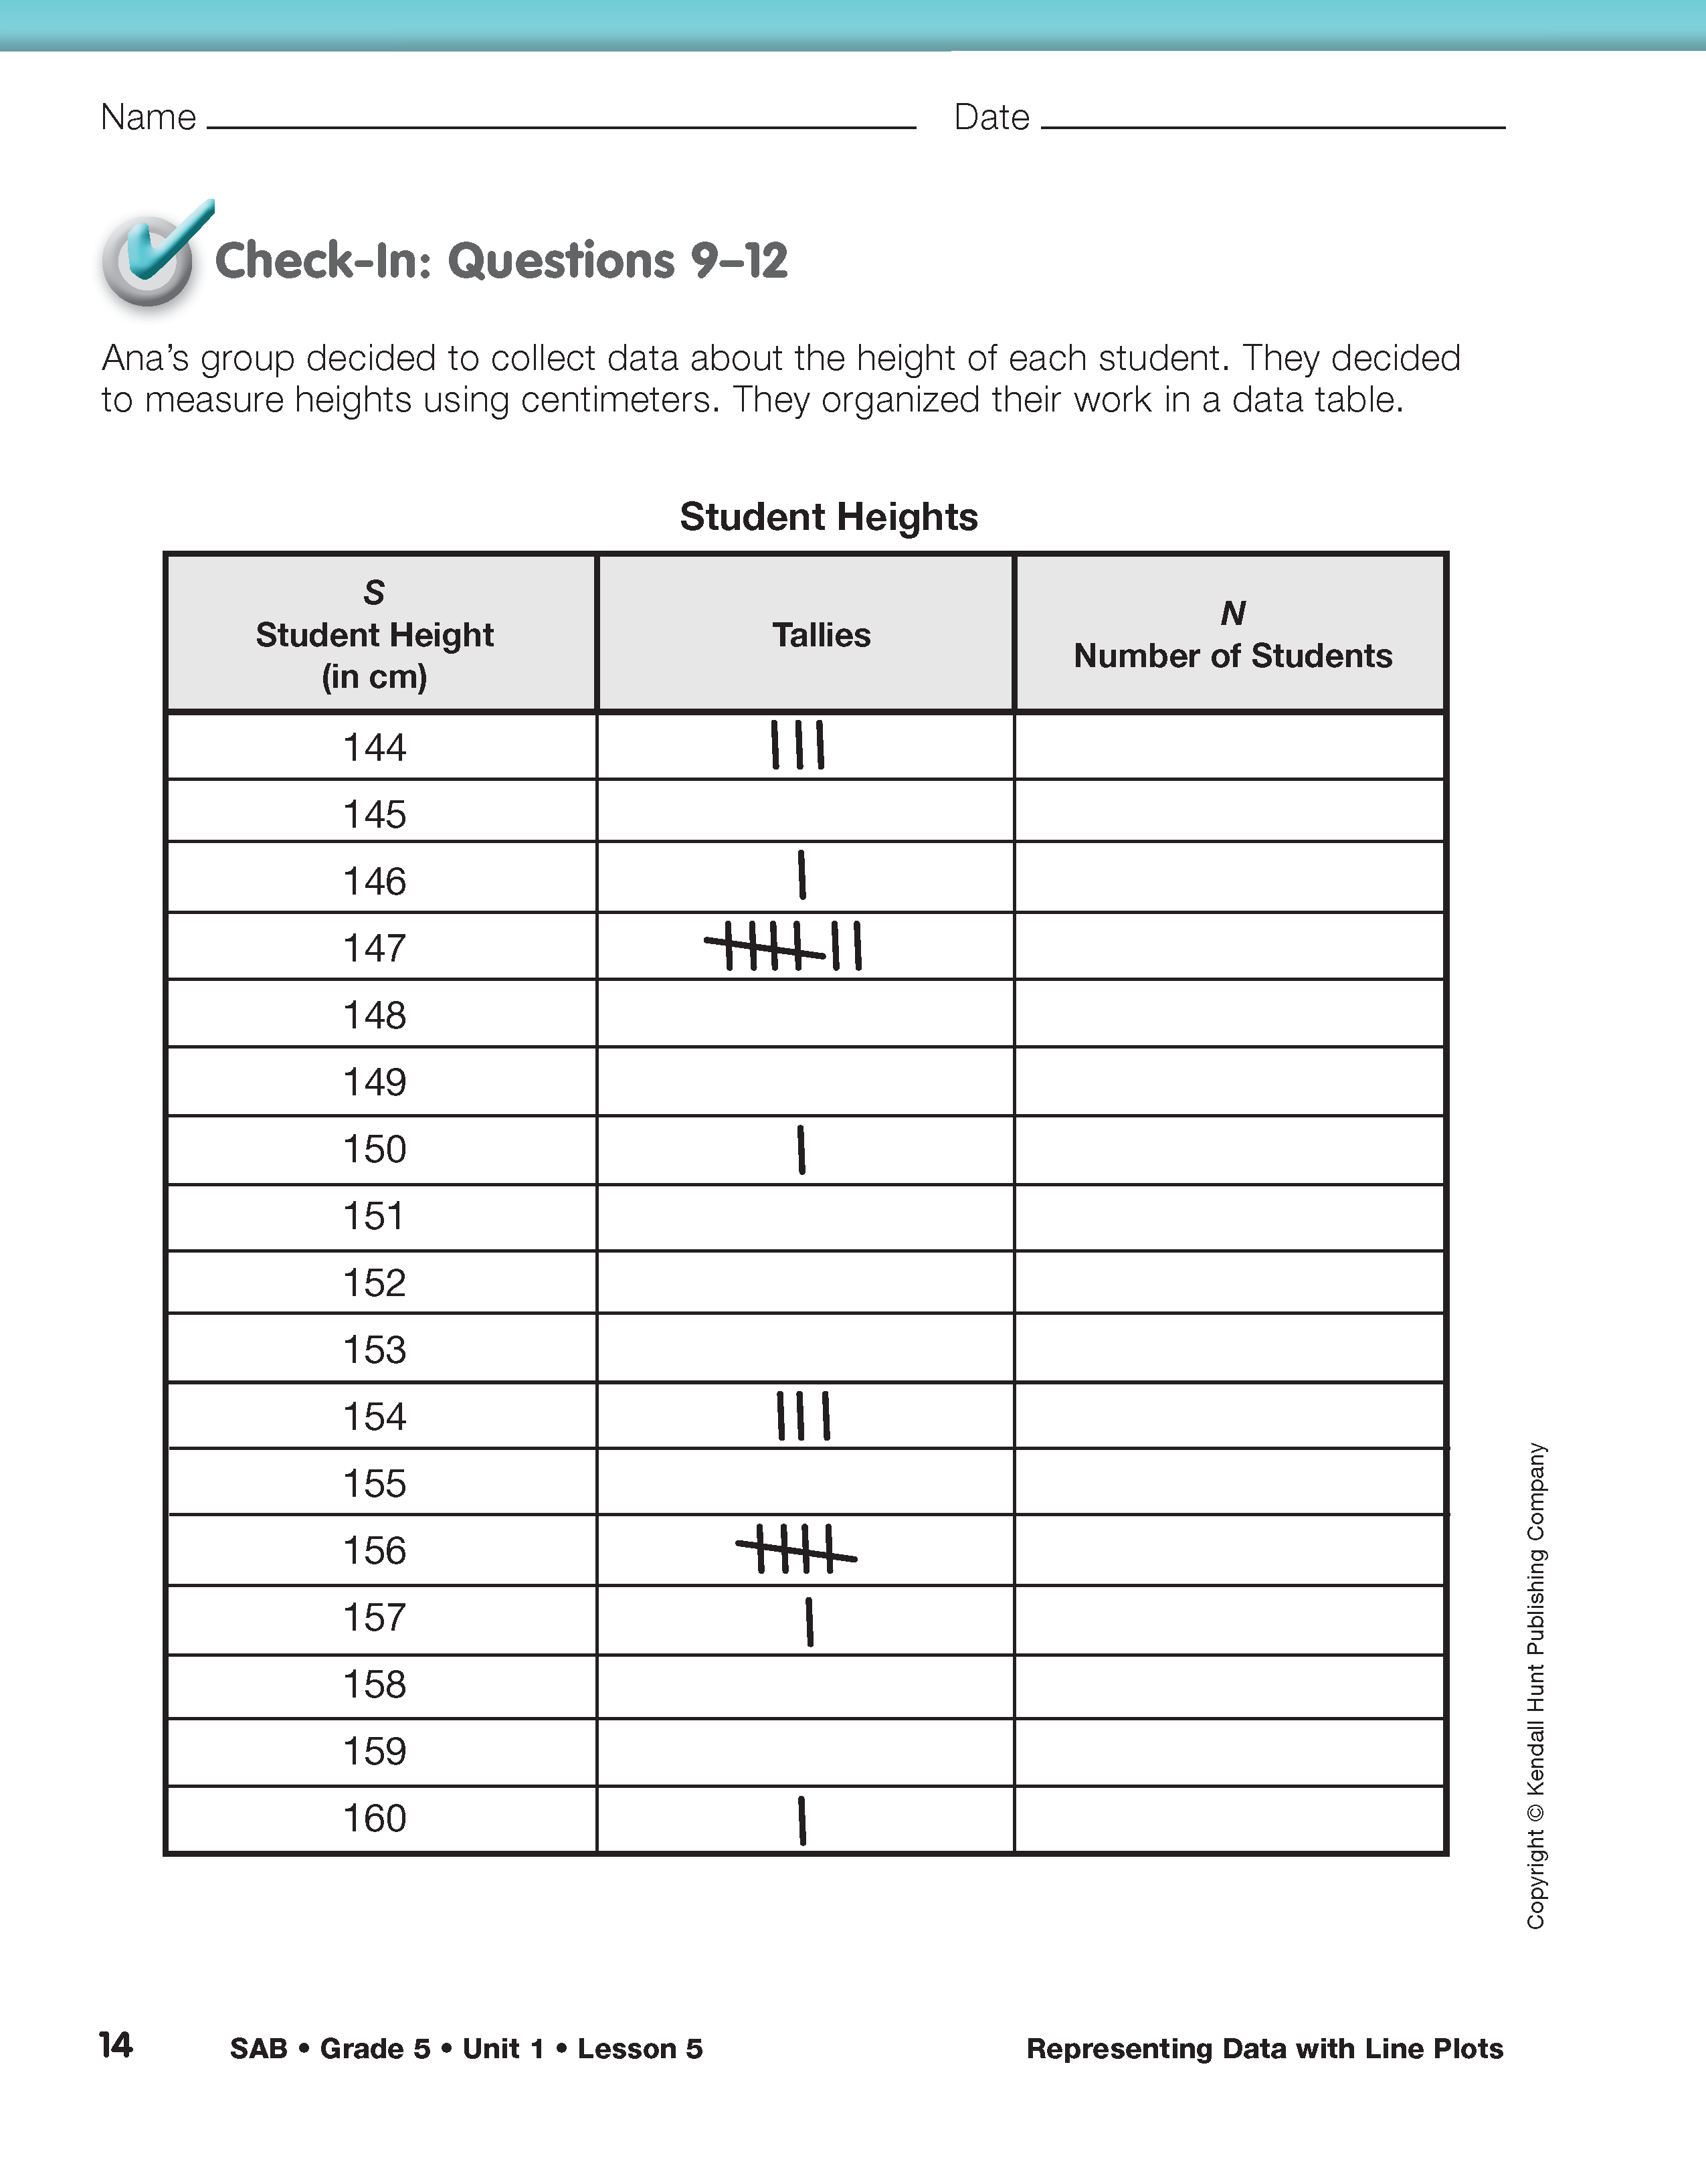
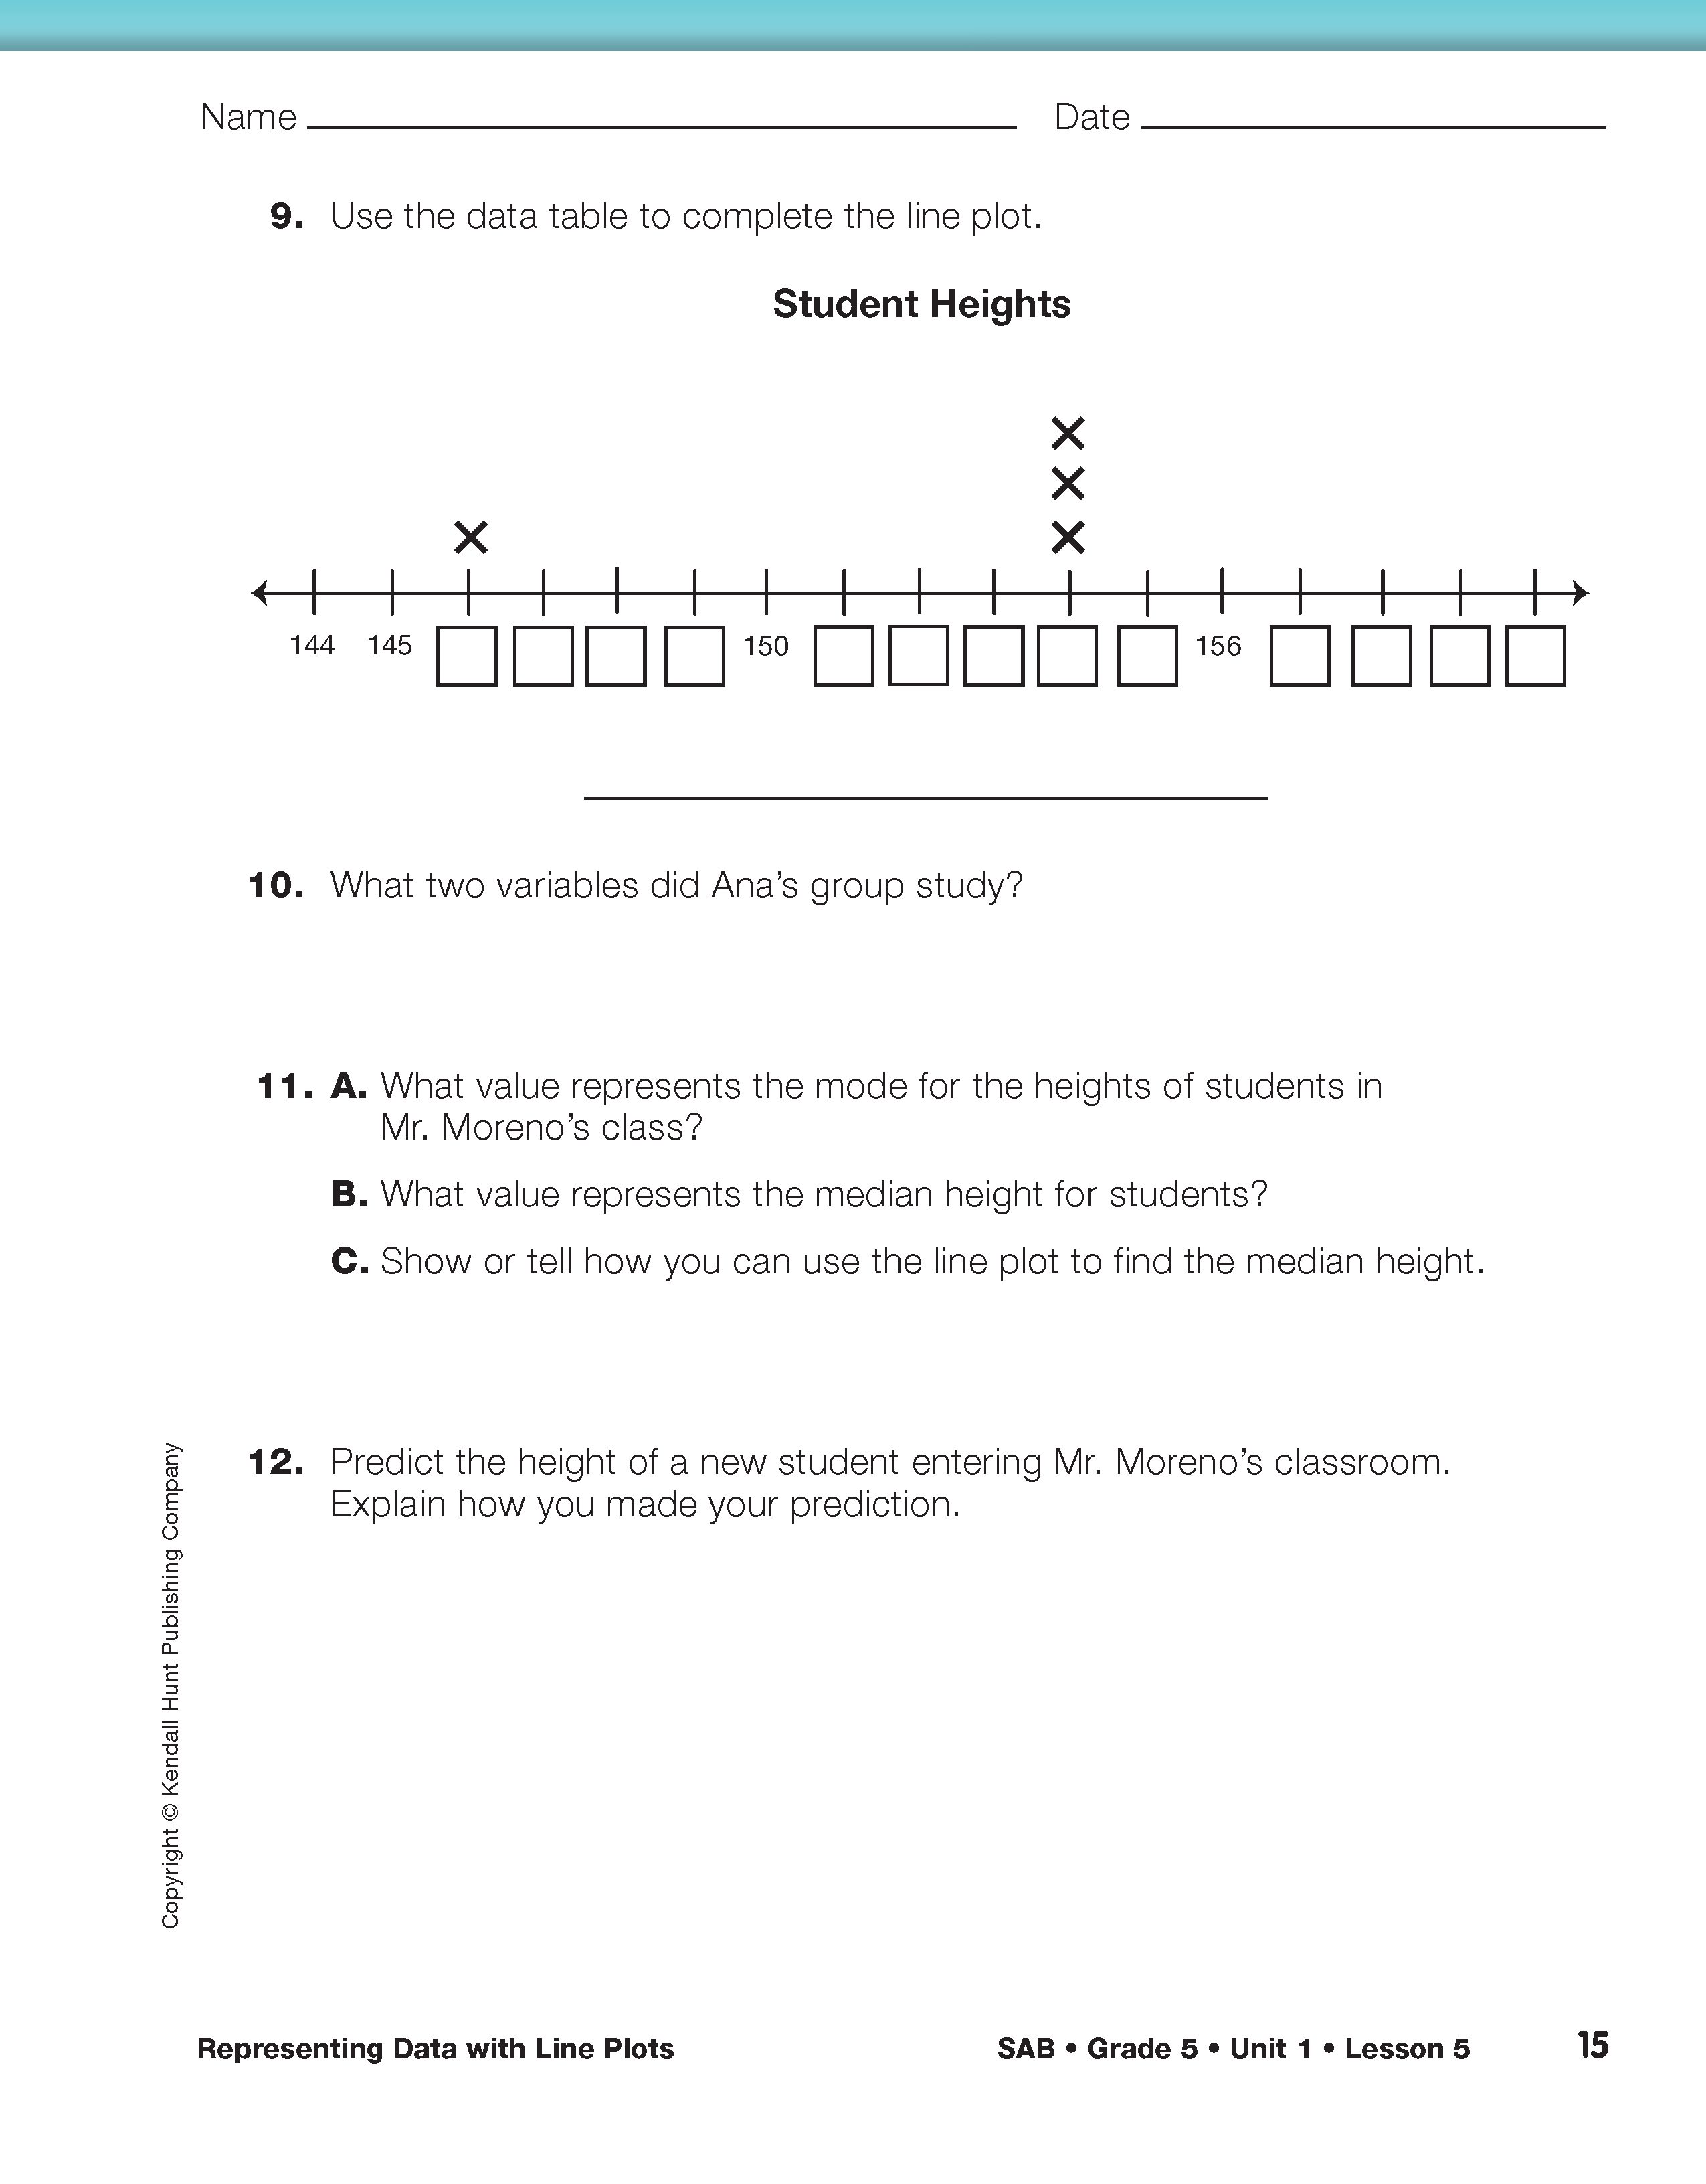
Assign Check-In: Questions 9–12 on the Use Line Plots pages in the Student Activity Book. Have students complete these questions independently.
Use Check-In: Questions 9–12 on the Use Line Plots pages in the Student Activity Book to assess students' abilities to make a line plot using numerical data [E4], read a table or line plot to find information about a data set [E7], and make predictions and generalizations about a data set using a data table or line plot [E10].