Lesson 5

Representing Data with Line Plots

Est. Class Sessions: 1
X

Mathematical Standards

5.MD.A
Convert like measurement units within a given measurement system. (5.MD.A.1)

Standards for Mathematical Practice

MP2.
Reason quantitatively.
MP4.
Model with mathematics.
MP5.
Use appropriate tools strategically.
MP7.
Look for and make use of structure.

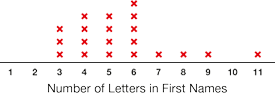
Students use line plots to represent data gathered from surveys. They use line plots to find the mode and median of a data set and to answer questions about the data.

Content in this Lesson

  • Making a line plot using numerical data [E4].
  • Reading a table or line plot to find information about a data set [E7].
  • Making predictions and generalizations about a data set using a table or line plot [E10].
  • Identifying variables in an investigation [E1].
  • Finding the median and mode for a data set [E5, 6].

Daily Practice and Problems U–V

U. Play Digits Game Again

V. Addition and Subtraction

X

Materials for Students

Daily Practice and Problems Lesson Homework Assessment

Student Books

Student Guide
Student Activity Book

Teacher Resources

Teacher Guide - digital

Materials for the Teacher

Assessment in this Lesson

Assessment Expectation Assessed

Use Line Plots
Check-In: Questions 9–12
Student Activity Book
Pages 14–15

E4.
Make a line plot or bar graph using numerical data.
E7.
Read a table, line plot, or bar graph to find information about a data set.
E10.
Make predications and generalizations about a data set using a data table and graph.

Vocabulary in this Lesson