Workshop: Problem Solving with Data
Est. Class Sessions: 1–2Before the Lesson
Review student work progress from previous lessons to guide instructional decisions about the following Expectations:
- E3.
- Make a bar graph using categorical data.
- E4.
- Make a line plot or bar graph using numerical data.
- E7.
- Read a table, line plot, or bar graph to find information about a data set.
- E8.
- Model real-world situations with tables, line plots, and bar graphs.
- E10.
- Make predictions and generalizations about a data set using a data table and graph.
For each of these Expectations, evaluate students' progress using the following questions as a guide:
- Which students are having particular difficulties meeting the Expectations?
- Which students are making progress and need additional practice?
- Which students have already met the Expectation and are ready to extend their learning?
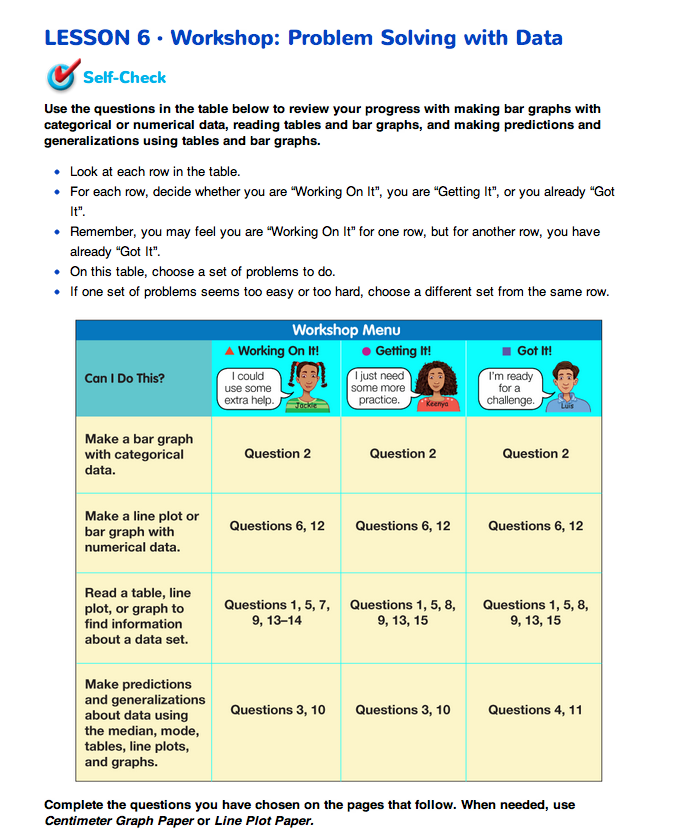
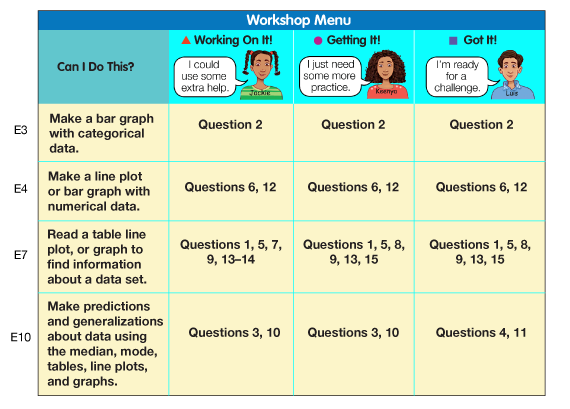
Review the Workshop Menu on the Workshop: Problem Solving with Data pages in the Student Guide to orient yourself to the organization and expectation focus of the workshop.
Students will self-evaluate to identify their level of confidence with a particular concept and choose problems from a Workshop Menu. See the TIMS Tip for more about Workshop Menus. See Figure 1.
Use your own evaluation of students' progress using work from previous lessons to help guide their choices.
Plan to organize the class into partners or small groups based on the problems they choose from the menu. Students can check each other's work and discuss solutions. Students may work with different groups or partners as the Workshop progresses.


