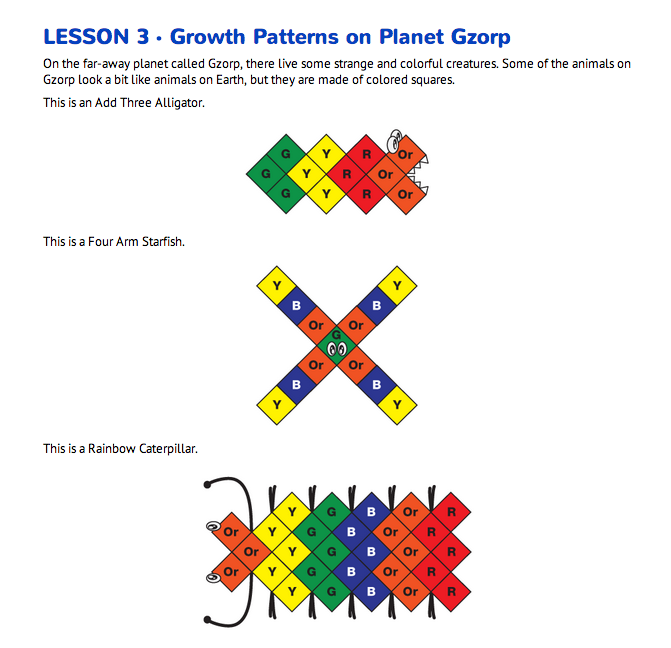
Add Three Alligator. Read together the opening for Growth Pattern on Planet Gzorp in the Student Guide. Explain to students that they will be building models of animals from Gzorp out of square tiles.
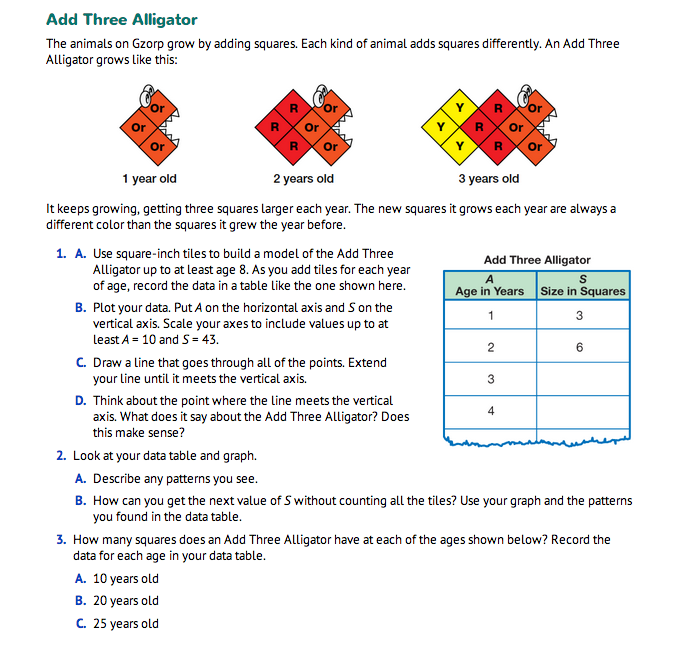
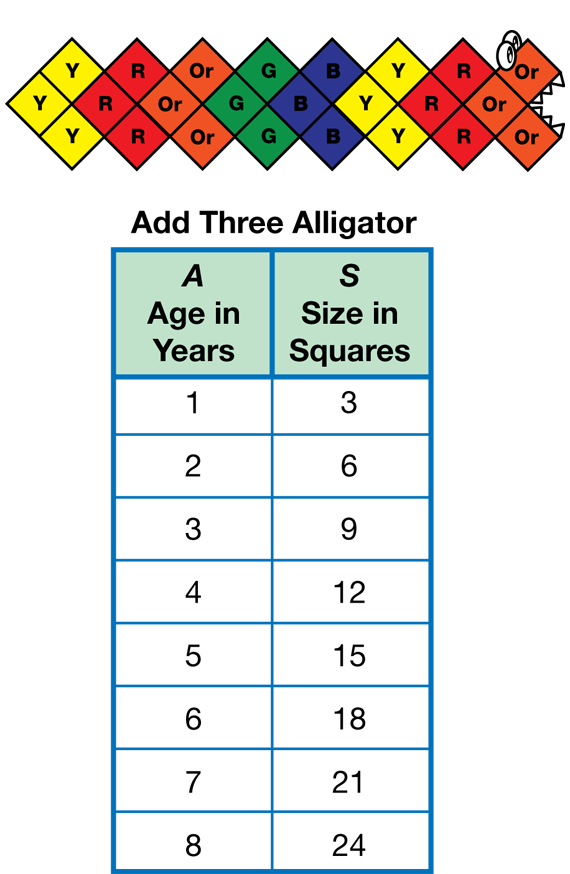
Read and demonstrate the growth pattern of the Add Three Alligator as shown in the diagrams in the Student Guide. Have students work in pairs complete Question 1–7 in the Student Guide. To begin their exploration, they construct and “grow” their models up to the 8th year in age. Direct students to keep track of each year's growth by changing the tile color for each year of age and creating a data table to record the total number of tiles by year as shown in Figure 1 (Question 1A).

Arithmetic Sequence. In this lesson, students investigate a particular type of pattern known by mathematicians as an arithmetic sequence. Each term in an arithmetic sequence increases a fixed amount from the previous term. Counting by ones and skip counting both represent arithmetic sequences because they increase by the same amount for each term. Another arithmetic sequence is 5, 8, 11, 14,. . . Each term is 3 greater than the one before it. These patterns can be represented by rules and formulas so that predictions can be made about them. At this point, it is not necessary for students to use the phrase “arithmetic sequence.”
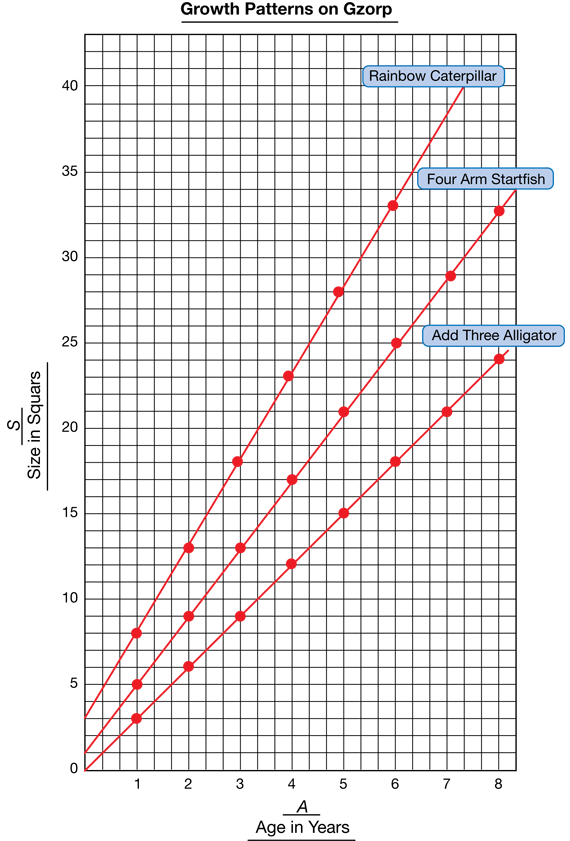
After students have completed the Add Three Alligator Table, display the Half-Centimeter Graph Paper Master. Tell students that they will plot data points for the Add Three Alligator as well as other animals from Gzorp on the same set of axes. The horizontal axis includes values up to at least 8 years of age, and the vertical axis includes values up to at least 43. See Figure 2. Show students how to scale the axes so that all of these points fit on the same graph. Remind students to title the graph and label the axes. Ask student pairs to plot the data points and draw a line through the points for the Add Three Alligator (Question 1B–C).
For this graph, the data points lie exactly on a straight line. Therefore, the lines students draw for Question 1C should pass through all of the points and extend until it meets the vertical axis. The question of whether or not the line should pass through the point (0, 0) is an important one for students to discuss (Question 1D).
They extend the line until it meets the vertical axis. See Figure 2. Discuss Question 1D.
- When is 0 years in the life of an animal? (birth)
- What is the point where the line meets the vertical axis? (0 years, 0 squares)
- What does that mean for the Add Three Alligator? (Possible response: It just has teeth when it is born! It does not have any squares.)
For Question 2, students describe patterns and use them to find the size (S) of animals.
When points on a graph are based on quantities that are measured or counted, you must think about the validity and meaning of points that lie beyond the range of the known data. For example, it is not certain what an Add Three Alligator looks like at birth (zero years of age) because there is no picture of it. Therefore, there is room for interpretation whether or not the line on the graph of S versus A should include the origin. If it does include the origin, it would mean that the alligator has no size when it is zero years of age. Since this would not be likely – even for an imaginary alligator from another planet – it can be argued that the line should not include the origin. Realistically, it should not extend to the left of (1, 3) since it is uncertain from the data what an Add Three Alligator looks like before it is one year old. Students may wish to justify the viewpoint that the line should include the origin. This can lead to a meaningful classroom discussion about how the data shown in the graph relates to the actual problem situation.
Some students may have difficulty seeing patterns, or may only see patterns that develop down the columns. They may not readily see the relationship between the two variables that are seen when looking across the rows. If students are not recognizing these relationships on their own, suggest that they look both down and across the data table.
- What patterns do you see as you look down the columns of the data table? (The age in years increases by one for every new year. The size in squares increases by three for every year. The sizes are multiples of 3.)
- How does the pattern in the data table match the model of the animal made with tiles? (Possible response: For each year, you add three more tiles to the model.)
- Does the age have to go up by exactly one year for each new row in the table? (No. A data table can include any ages that the experimenter wants. For example, if he or she wants to include data in the table for an age of 100 years, there is no need to include all ages up to 100 years in the data table.)
- What patterns do you see as you look across the rows? (The size in squares is always three times the age in years.)
- Does the size have to go up by three squares for each row moving down the table? (No. Size only has to go up by three squares for every year represented in the table, not necessarily for every row. For example, the size of a 10-year-old alligator would be recorded as 30 squares in the table. If the next data point included in the table was for a 20-year-old alligator, the size would not be 33 squares (an increase of 3 from the previous size recorded in the table), it would be 60 squares.)
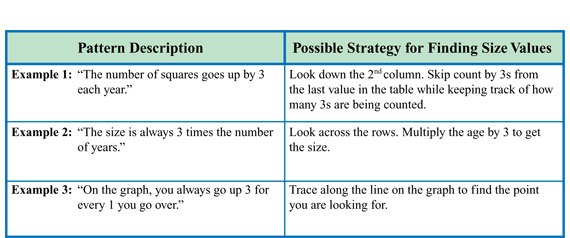
Some examples of pattern descriptions are shown in the first column of the table in Figure 3.
In Question 3, students find sizes at ages of 10, 20, and 25 years. Allow students to use flexible methods to solve the problem. The methods they use will likely depend on the way they described the pattern in Question 2. The second column of the table in Figure 3 shows a possible strategy related to each sample pattern description.
Strategies for Describing Patterns. There is an important difference between the pattern descriptions in Example 1 and Example 2 in Figure 3. In Example 1, the student's description relates a term in the pattern to the term directly before it. Mathematicians call this a recursive relationship. In this case, the number of squares in any year is three more than the year before. Rather than relating each term to the previous term, the student in Example 2 relates the size in squares to the age in years. Using this relationship, terms in the pattern can be predicted without knowing the previous term. Students should explore both of these methods of describing patterns by looking down the columns and across the rows.
In Question 4, students are asked to write a rule that relates size (S) to age (A), using both words and a number sentence, or formula. Modeling a pattern as a formula can be challenging for some students, depending on their pattern descriptions. For instance, in Example 1, students may have some difficulty writing a formula relating size (S) to age (A) because the pattern description relates the sizes recursively to the previous value of (S), not to age (A). In this case, students may answer with the incorrect formula S = A + 3 based on this pattern description. The pattern description in Example 2 will more likely lead to the correct formula, S = 3 × A.
Students use their formulas to make predictions about Add Three Alligators in Questions 5–7. They do so by substituting known values into the formula to find the unknown values.
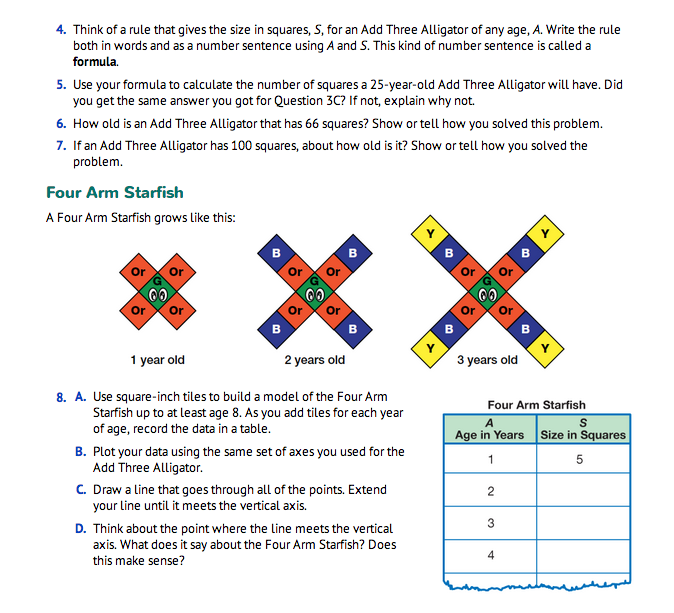
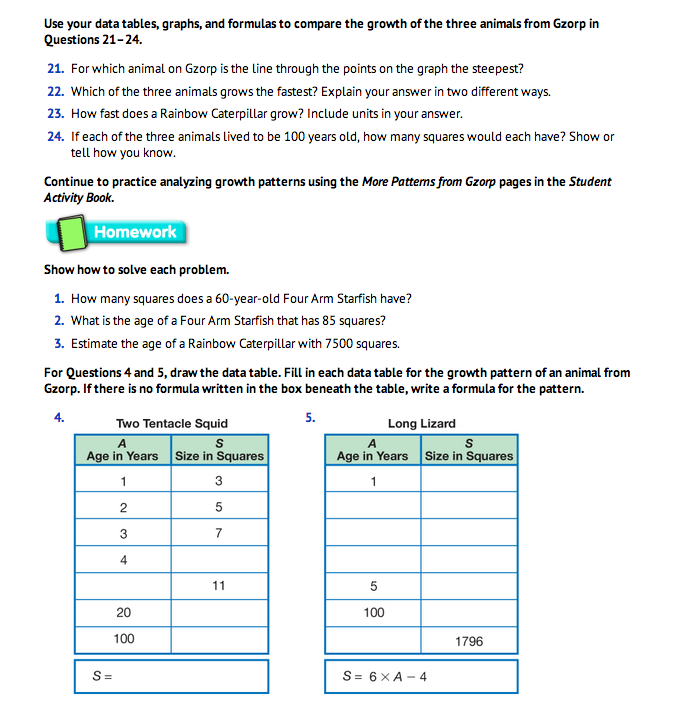
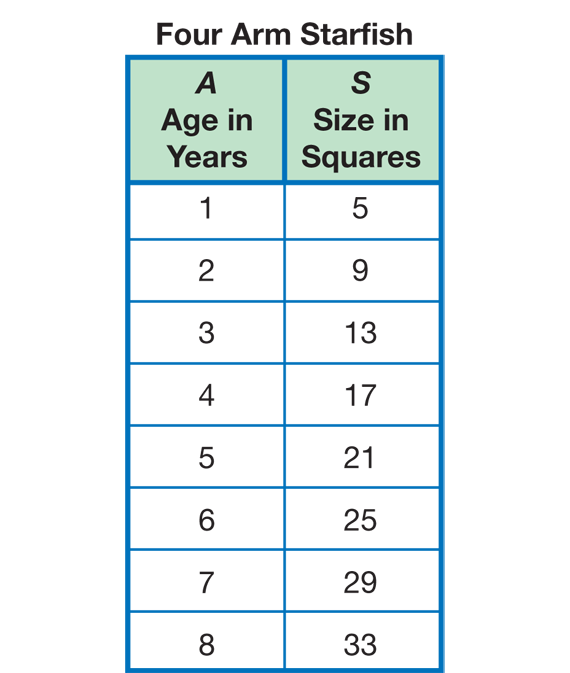
Four Arm Starfish. Next students explore the growth pattern for another creature from Gzorp, the Four Arm Starfish. As with the Add Three Alligator, students build a model of the animal's growth with square-inch tiles, collect data, draw a graph, look for patterns, write a formula, and make predictions about growth over time (Questions 8–13).
For Questions 8B and 8C students graph their data. They should do so using the same set of axes that they used for the Add Three Alligator. Ask students to label each line they draw on the graph with the animal it represents. See Figure 2 for a completed graph with data for all three animals plotted on the same axes. For Question 8D students think about what the point on the line that intersects the vertical axis means.
- What is the point where the line meets the vertical axis? (0 years, 1 square)
- What does that mean for the Four Arm Starfish? What does it look like at birth? (It has one square.)
- Does that match the model of the starfish you made with squares? Why or why not? (Yes, it matches. The starfish grows by 4 squares each year. If you take away 4 squares from the model of what it looks like at 1 year, there will be 1 square left.)
For Question 9A and 9B, students describe the growth pattern of the Four Arm Starfish. Although the Four Arm Starfish grows by adding 4 squares each year, the size in squares does not simply increase as skip counting by 4s from 0. This is because it has a size of 5 squares when its age is 1 year.
- What strategies did you try to find the growth pattern of a Four Arm Starfish (Questions 9B and 10)? (Possible responses: I saw that the number of squares goes up by 4 each year. I looked across the rows and multiplied the age by 4 but was one short each time.)
- What is different about the growth pattern of the Four Arm Starfish and the Add Three Alligator? (Possible response: The Add Three Alligator started with 3 squares at one year and grows by the same number. The Four Arm Starfish starts with 5 squares and grows by 4 each year, a different number.)
It may be more challenging for students to think of a rule and write a formula for the Four Arm Starfish (Question 11) than for the Add Three Alligator. Several guesses may be needed to arrive at a rule that describes the pattern. Encourage students to talk with their partner to see if they find a formula of growth for the Four Arm Starfish.
The Sample Dialog shows how students might find a rule from a completed data table for the Four Arm Starfish in Figure 4.
After students have completed Questions 9–13, assign students to role play the Sample Dialog. Ask students to try the formula S = 4 × A + 1 to find the answers to Questions 10, 12, and 13.

This dialog models student strategies for generalizing a formula from a number pattern.
Teacher: Okay, so look at your data table to see if we can find a way to look across the rows and relate size to age. When the starfish is 4 years old [points to the 4 in the left-hand column of student's data table], what is its size in squares?
Tanya: Um...17.
Teacher: Yes. And when the starfish is, say, 2 years old [points to the 2 in the left-hand column], how many squares does it have?
Tanya: 9 squares.
Teacher: Okay, so how do you get from 2 to 9?
Tanya: Add 7. So the rule is you add 7 to the first column to get the second column.
Teacher: You add 7. But what if I add 7 to 3 [points to the 3 in the left-hand column]?
Tanya: You get 10. Oh, no, that can't be right. The size has to be 13.
Teacher: You could have been right, because that's one way to get from 2 to 9—adding 7. But it can't be that rule because it didn't work for the second pair, 3 and 13.
John: Oh, I know. You have to add 10?
Teacher: You add 10? So if you add 10 to 2 you get how much?
John: 9.
Teacher: No, you don't get 9.
John: 12.
Teacher: Let's look at another pair of numbers. If you start with 1, that gives 5.
John: Oh, 1 times 5 equals 5.
Teacher: 1 times 5 would be 5. But 2 times 5 isn't 9. And 3 times 5 isn't 13.
Keenya: How about 4 times the number, since the squares go up by 4 every time.
John: That almost works. 2 times 4 is 8. 3 times 4 is 12. But it's one too few every time.
Keenya: So we can add 1. It's 4 times the number and then add 1.
John: Does it work for 5? Let's see, 5 times 4 is 20, then add 1 and you get 21. It works for that one too.
Teacher: Check a few more to make sure it works. Then see if you can write a formula for Keenya's rule, using A and S.
Keenya: I think I got it. It's S = 4 × A + 1.
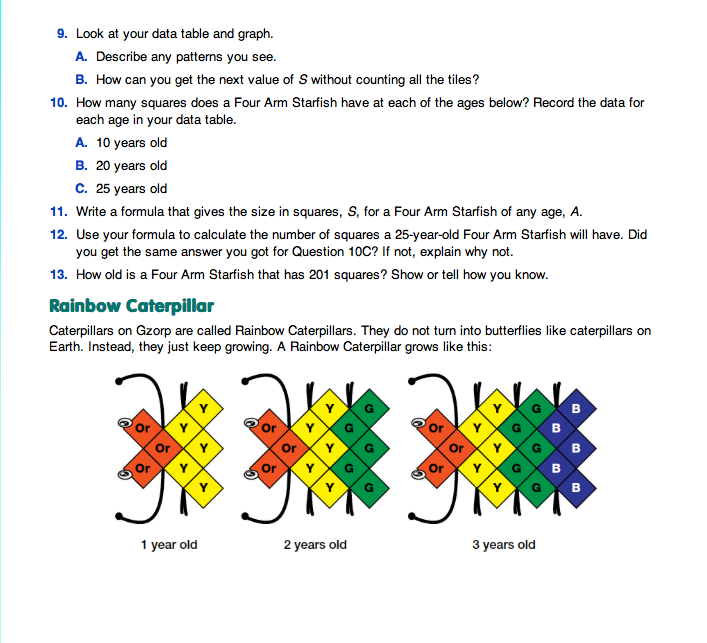
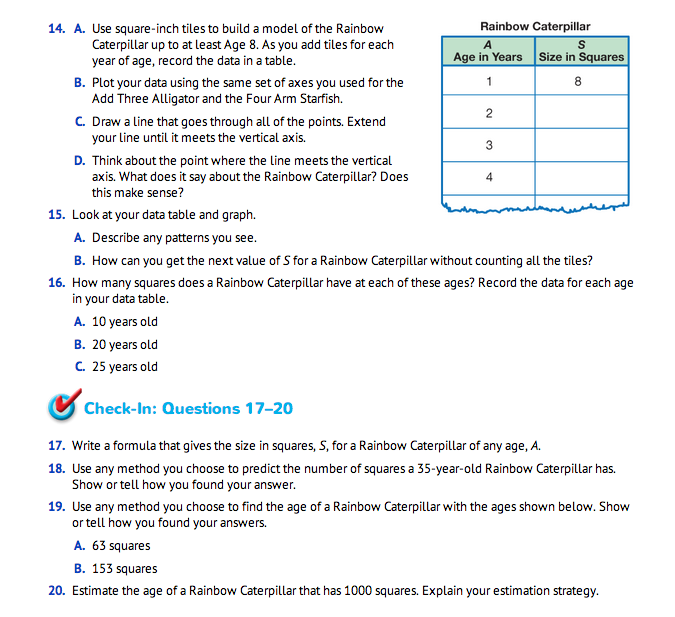
Rainbow Caterpillar. The growth pattern for the Rainbow Caterpillar is similar to the Four Arm Starfish but involves slightly larger numbers. Have students work in pairs to model the growth, then graph the data and make predictions. The data should be plotted on the same axes as the previous two patterns.
After student pairs have worked together on Questions 14–16, ask:
- What patterns did you notice in the growth pattern of a Rainbow Caterpillar? (Possible responses: The age gets bigger by 1 each year and the size gets bigger by 5 squares each year. All the sizes end in 8 or 3.)
- How could you find the next value for size? (Possible response: I could find the size by adding 5 squares to the year before. I could multiply the age by 5 and add 3 to get the size. I have to add three because in year one the Rainbow Caterpillar is 8, not five. So the extra three need to be part of the Rainbow Caterpillar's size every year.)
- What is different about the growth pattern of the Rainbow Caterpillar and the Add Three Alligator? (Possible response: The Add Three Alligator started with 3 squares at one year and grows by the same number. The Rainbow Caterpillar starts with 8 squares in year one and grows by 5 each year, a number different from the starting number.)
Assign Check-In: Questions 17–20 for students to complete independently.
Use Check-In: Questions 17–20 in the Student Guide and the corresponding Feedback Box in the Teacher Guide to assess students' abilities to identify and describe number patterns [E3]; use variables in formulas to represent number patterns and make predictions [E4]; represent number patterns using words, tables, and graphs [E8]; make predictions and generalizations using data tables and graphs [E9]; find a strategy [MPE2]; check for reasonableness [MP3]; and show their work [MPE5].
Comparing Patterns. Prepare a display of the Rainbow Caterpillar, Four Arm Starfish, and the Add Three Alligator graph by asking three students to plot the data points and draw best lines on a display of the Half-Centimeter Graph Paper Master. Ask students to discuss Questions 21–25 in small groups and then discuss the questions as a whole class. Students are asked to use the tables, graphs, and formulas to compare the growth patterns of the three animals.
In Question 21, students refer to the three lines on the graph and think about how the “steepness” of each compares to the others. Figure 2 shows the data points and lines for all three growth patterns on the same set of axes.
- Which of the three lines do you think is the steepest? (the Rainbow Caterpillar's line)
- What makes one line steeper than another? (A line that rises more quickly, or more per year, is steeper.)
- What do you think steepness means for how the animal grows? (A steeper line means the animal
grows more quickly, or gets bigger faster.)
Questions 22–23 ask students to decide which animal grows the fastest and which grows the slowest. Students may justify their answers based on steepness of the line on the graph as discussed in Question 21. Have students share their answers to Question 21 with a partner to talk about growth rate using more than one representation.
- Can you justify your answer in another way? (Possible response: The Rainbow Caterpillar grows more quickly because the data table shows that 5 squares get added to it each year. The Add Three Alligator only adds 3 squares each year and the Four Arm Starfish only adds 4 squares each year.)
Question 24 asks students to find the number of squares for each animal if they live to be 100 years
old.
- What is the size in squares for each animal? How did you find out? (300 squares, 401 squares, and
503 squares. Possible response: I used the formulas.)
- Which animal is largest at 100 years? (the caterpillar)
- Does that make sense based on which one grows fastest? (Yes. Since the caterpillar started out with the most squares and grows the fastest, it will grow to be the biggest after 100 years.)