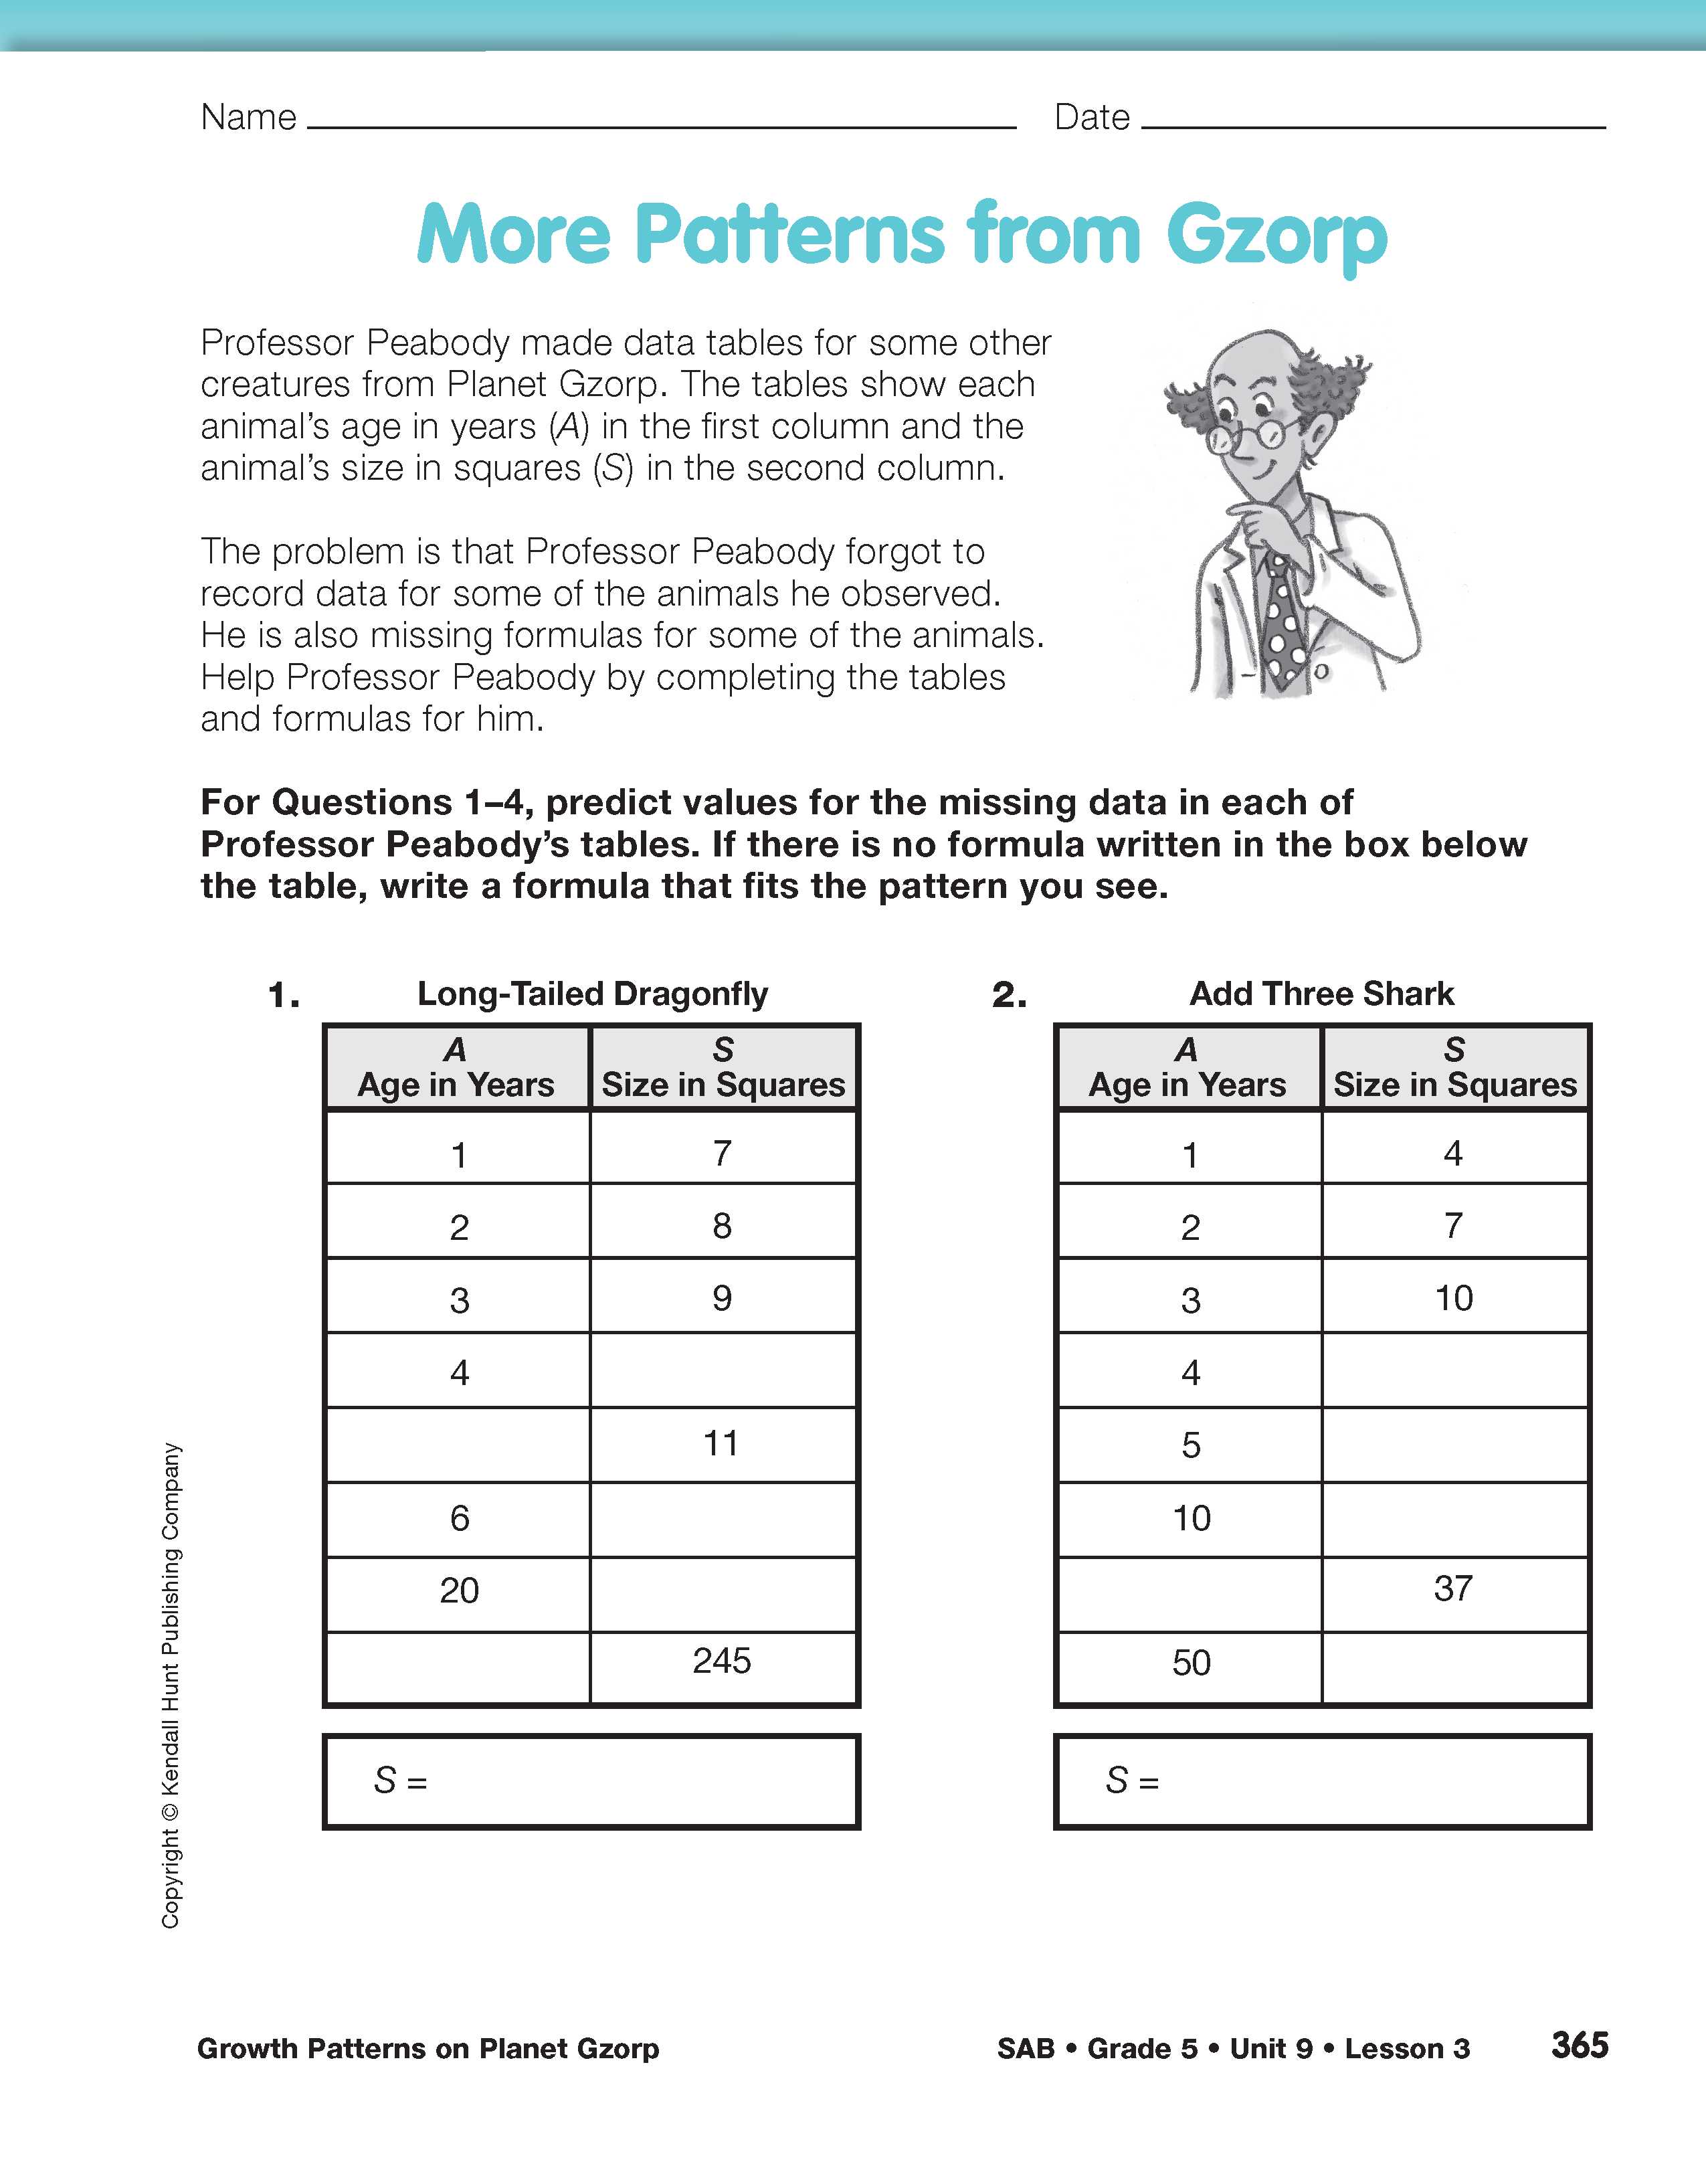
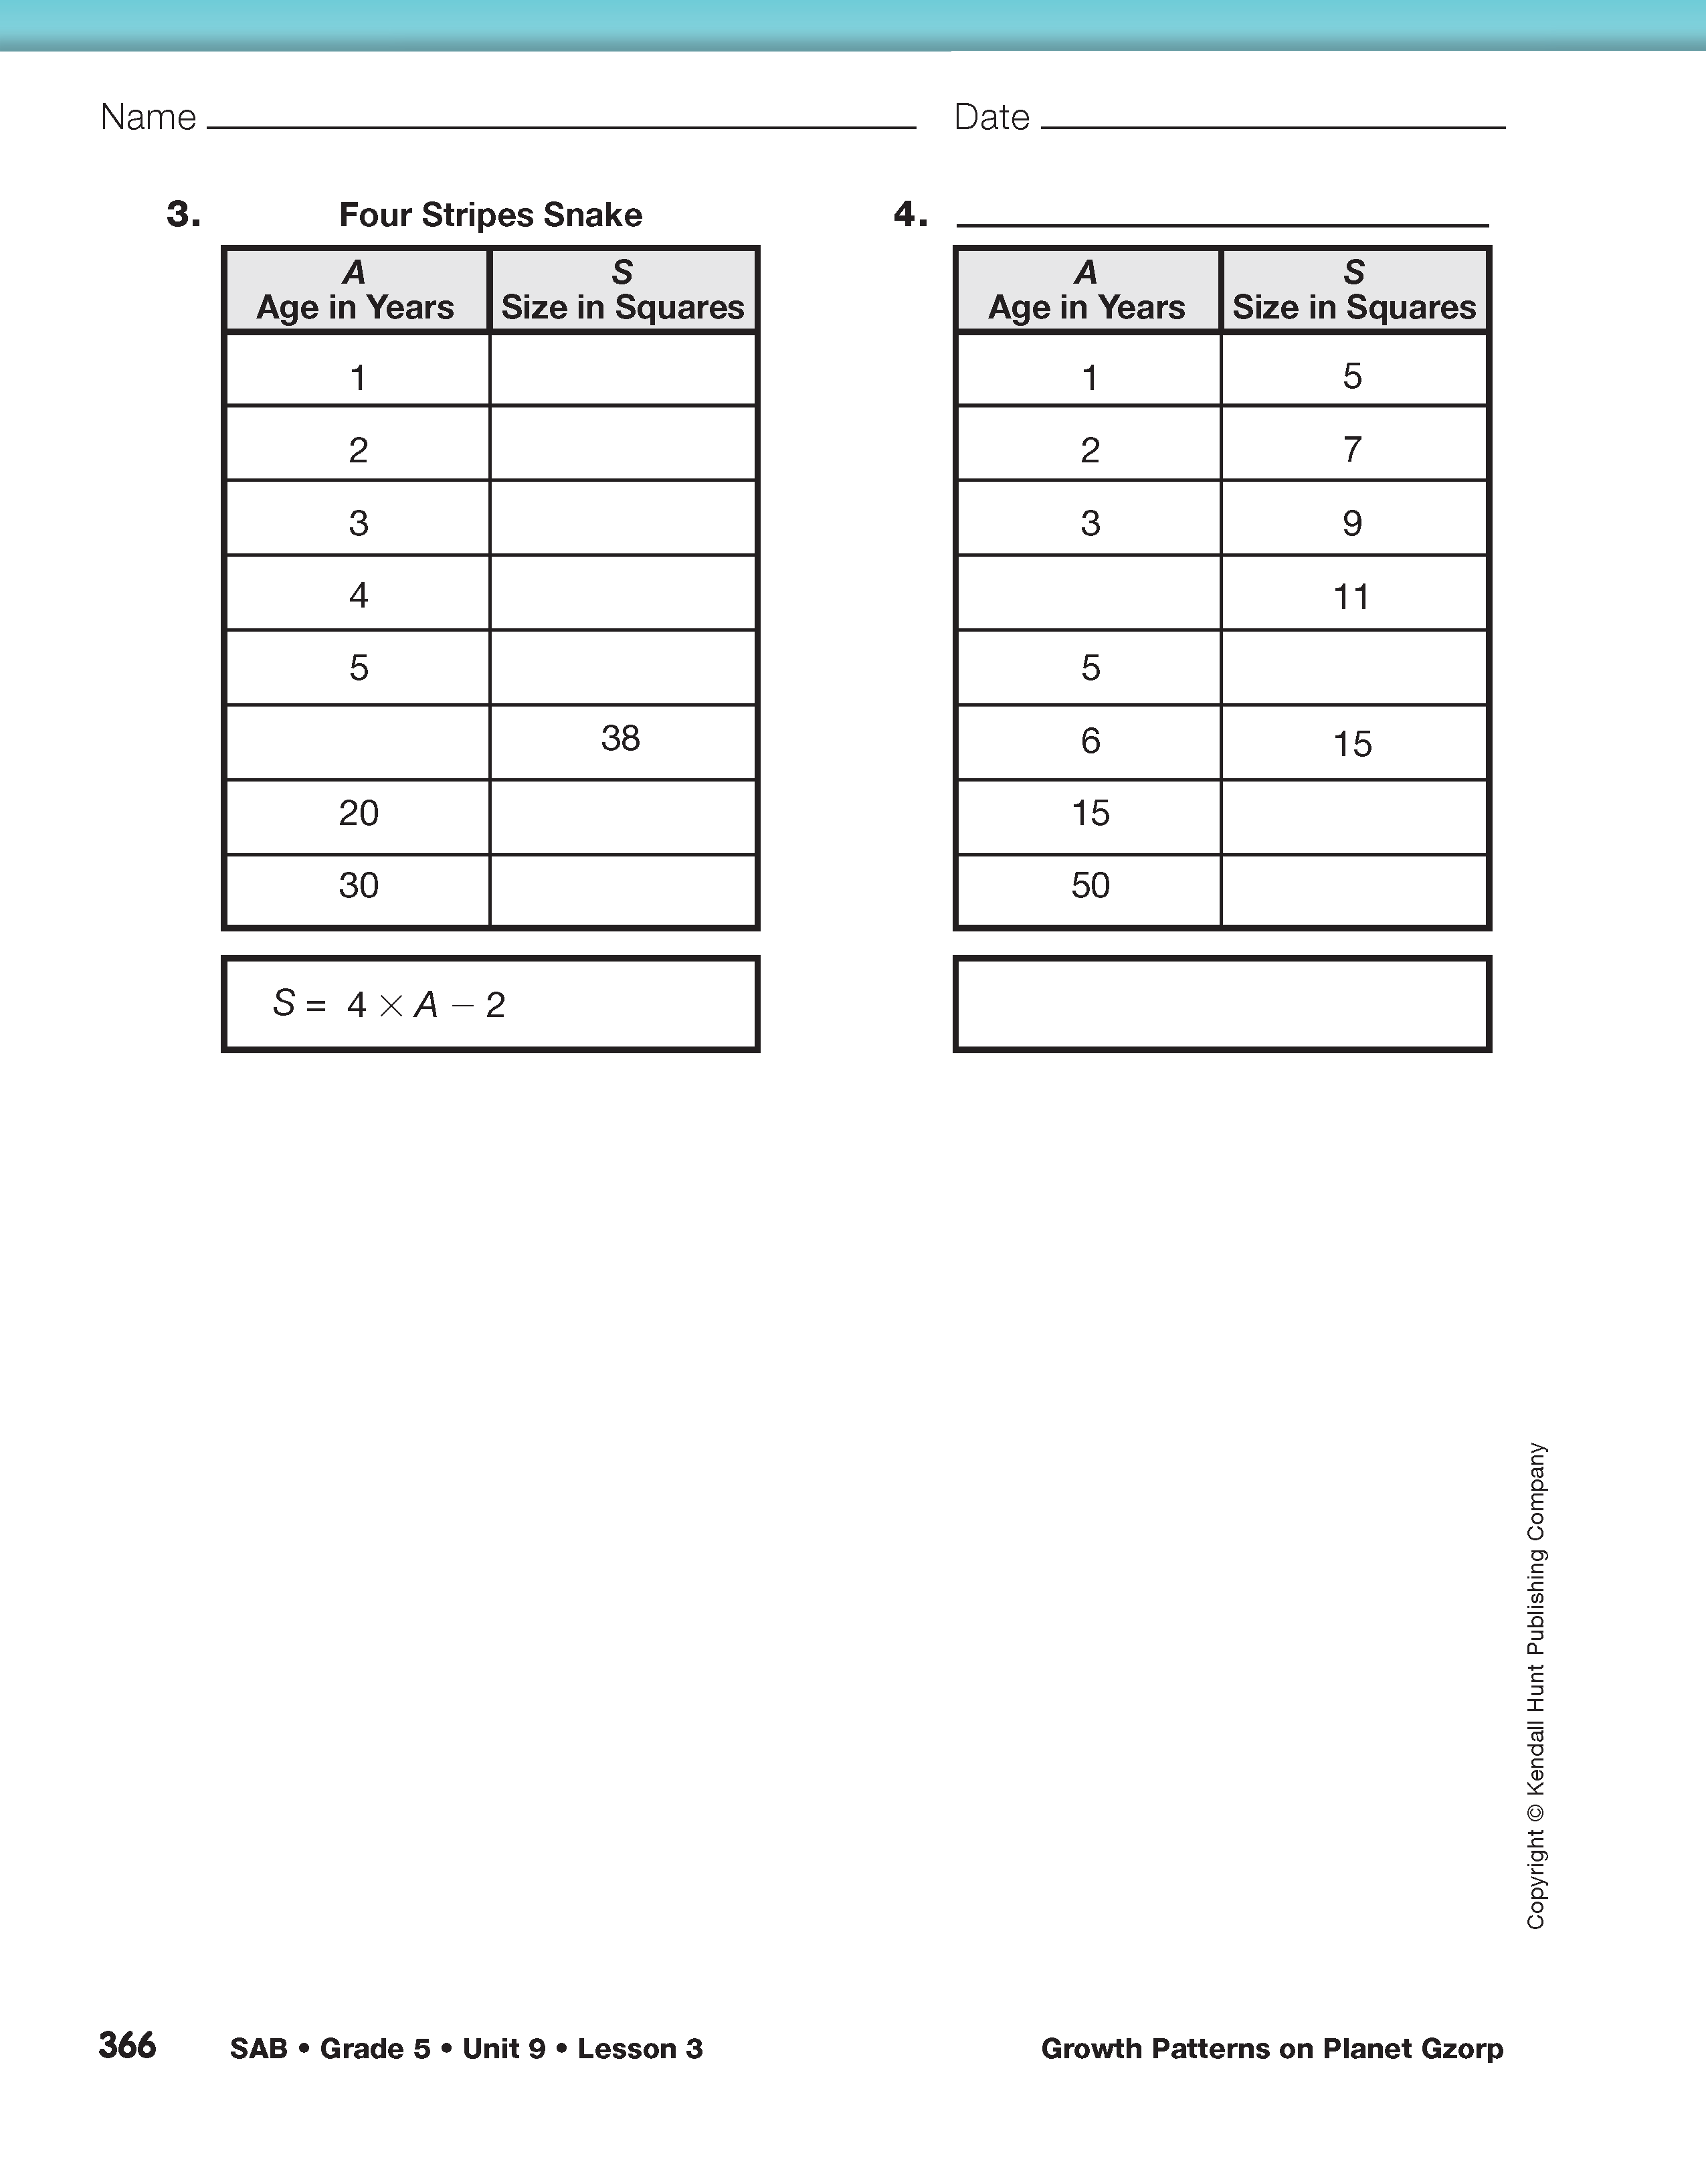
Use the More Patterns from Gzorp pages in the Student Activity Book to summarize the lesson. In this activity, students work with partners or in small groups to analyze growth patterns from data tables similar to the patterns in the lesson.
In Questions 1–2, students find formulas for the patterns. They may do so before filling in the table, using the formula as a way to find the missing data. They may also complete the data tables first, and then write formulas to fit the data. In Question 3, a formula is given to help students fill in the missing data.

Modeling Patterns. In most cases, there are many different ways that a pattern can be modeled mathematically. For example, for the sequence of numbers 1, 2, 4 . . . , there are several simple ways to describe the pattern. One could say, “Start with one, then add 1, then add 2 . . . ” This description would give 7 as the next term, since the next logical step would be to add 3 to the last term of 4. However, one could also describe the pattern by saying, “Start with 1, then double each time.” This description of the pattern would give 8 as the next term.
Although most of the patterns in this lesson are less open-ended than this example, it is almost always possible to find many formulas (though they might be mathematically complex) that fit a given data pattern. We therefore usually try to find the simplest rules and formulas that help us model and predict how a pattern behaves. When using mathematics to model real situations, the simplest rule or formula is typically the one that is the most useful.
Assign Check-In: Question 5 to assess the students' development of math practices. Go over Math Practices Expectations 2 and 3 the Math Practices page in the Student Guide Reference section together.
- How will you find a good strategy? (Possible response: I will write down the different formulas I try and the different model drawings I try, even if they don't work.)
- How will you check for reasonableness? (Possible response: When I get a formula, I will try it with all the numbers in the table to check if it works. I can also try the formula out on my drawing or model of an animal to see if it works.)
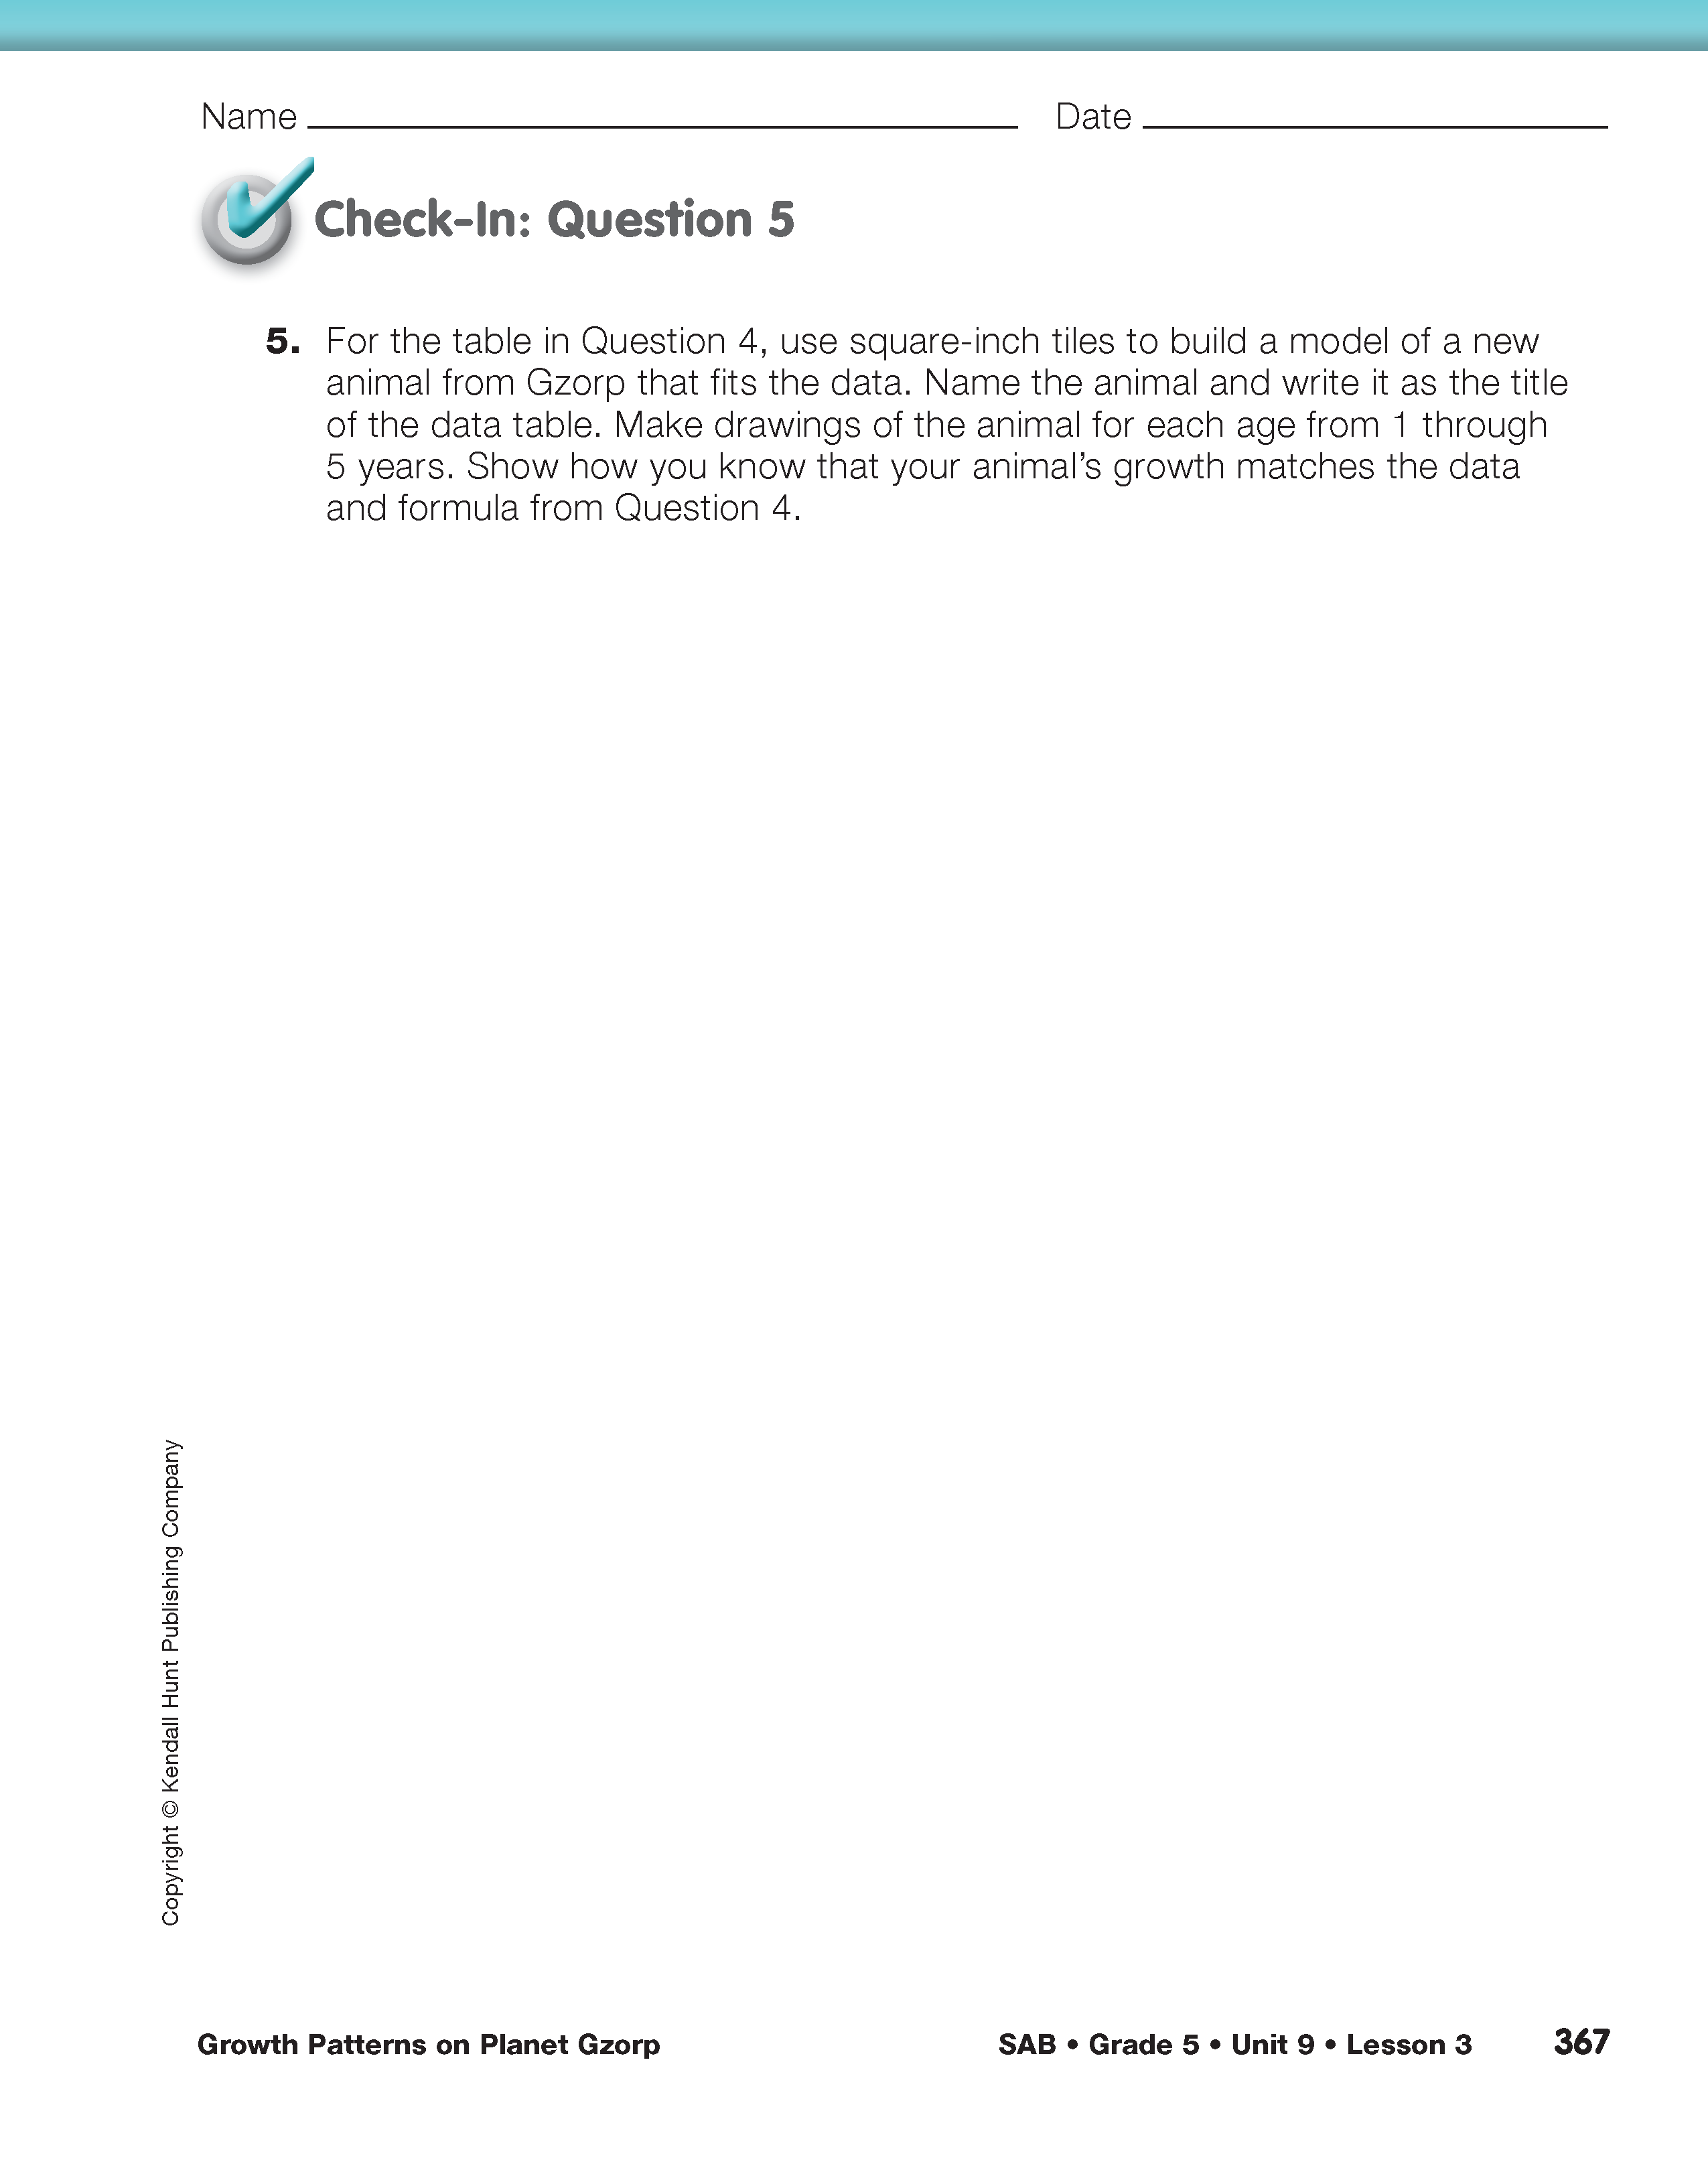
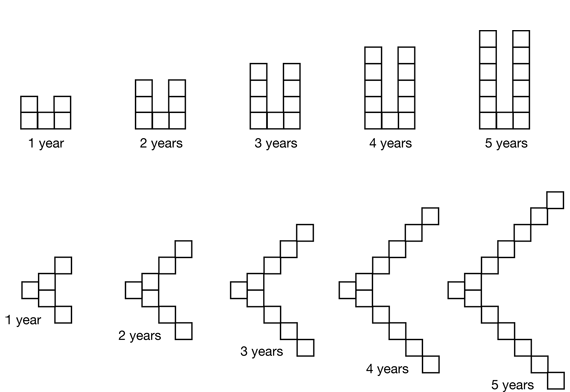
In Question 5, students work backward to build a model of a growth pattern from the data table and formula in Question 4. Students make conjectures about the shape and growth of the imaginary animal from Gzorp and then test their conjectures against the data pattern shown in the table and the formula. There are many possible growth patterns that fit the data and formula. Two possibilities are shown in Figure 5.
Use Check-In: Question 5 on the More Patterns from Gzorp pages in the Student Activity Book with the Feedback Box to assess students' abilities to identify and describe number patterns [E3]; use variables in formulas to represent number patterns and make predictions [E4]; represent number patterns using words, tables, and graphs [E8]; make predictions and generalizations using data tables and graph [E9]; find a strategy [MPE2]; and check for reasonableness [MP3].


