


Ratios, Recipes, and Proportions
Est. Class Sessions: 2–3Developing the Lesson
Part 2: Ratios, Proportions, and Graphs
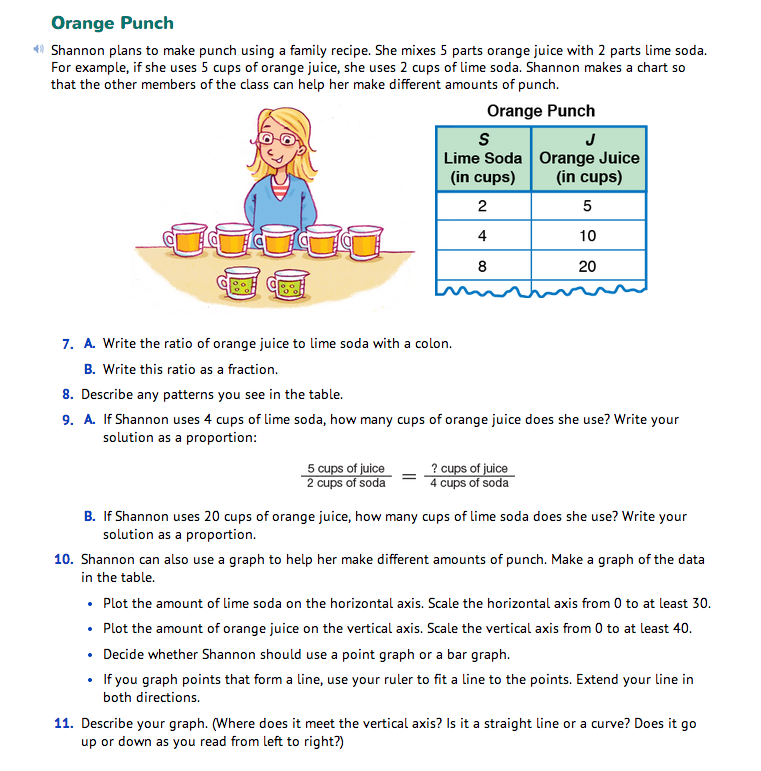
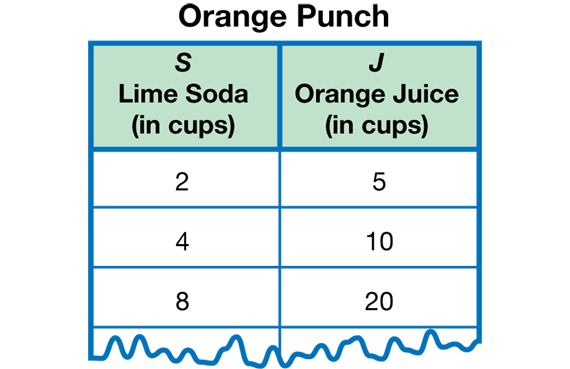
Reason Proportionally. In the Orange Punch section, students express the ratio 5 cups orange juice to 2 cups lime soda using a table, graph, and symbols. They use these tools and proportional reasoning to solve problems.
Read the Orange Punch vignette with the class. Display Shannon's Orange Punch table.
Have students work in pairs to discuss Questions 7–9. Then choose students to share their responses on a display and write how they used ratios and proportions to solve the problems in Question 9.
Ask these or similar questions:
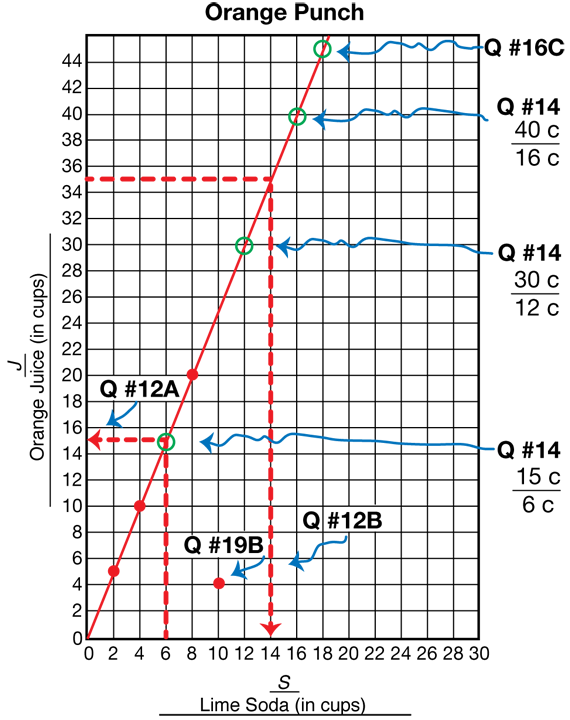
For Question 10–12, have students work in pairs to make the graph. Circulate around the room as students work to see how they label, scale, graph, and make a bar graph or a point graph. Display the blank Centimeter Grid Paper Master and select student pairs to come up to label, scale, and plot each of the data points on the display. Choose one group to make a bar graph on the display and another group to go over it using a ruler to fit a line to the data points, extending the line in both directions. See Figure 3 for an example graph.
Ask:
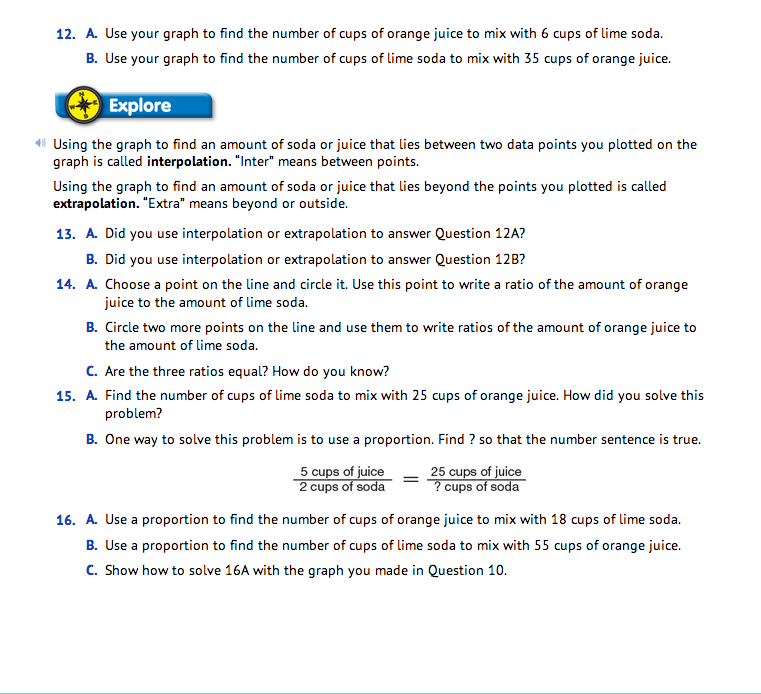
For Question 12A and 12B choose student pairs to plot the points on the display. See Figure 3. Review the terms interpolation and extrapolation in the Student Guide. Using the graph to make predictions with points that lie between the plotted data is called interpolation. Using points beyond the range of the plotted data is called extrapolation (Question 13).
For Question 14, students choose three points on the line and use them to write ratios comparing the amount of juice to the amount of soda. Three possible points are circled on the graph in Figure 3. The ratios for these points are below. The three ratios are equal since they all reduce to 5 cups of orange juice/2 cups sugar.
15 cups/6 cups = 5 cups/2 cups 30 cups/12 cups = 5 cups/2 cups 40 cups/16 cups = 5 cups/2 cups
For Questions 15A–B, students must find the number of cups of soda to mix with 25 cups of juice. See Figure 4 for a solution.
Since 5 × 5 = 25, we can multiply 2 × 5 to get 10 cups of soda. Note that we don't ask students to follow a specific procedure to solve the proportion. Instead we prefer students to solve proportions by relying on their previous knowledge of equivalent fractions.
Encourage students to use what they know about equivalent fractions to solve the proportion problems in Questions 16A–C. Students may use a variety of strategies to solve the problem such as:
- Graph or patterns in the table
- Multiplication
- Area models
- Equivalent fraction number lines
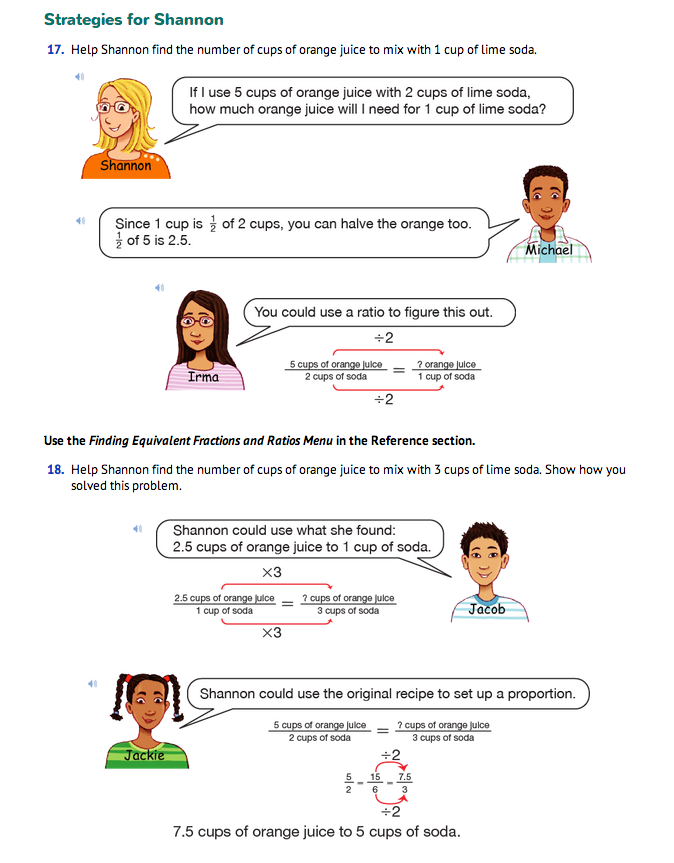
Explore a Variety of Strategies. Read the first part of the Strategies for Shannon section in the Student Guide together. For Question 17, students find the number of cups of orange juice to mix with 1 cup of lime soda. They can use division (5 ÷ 2) to find that 2 1/2 cups (or 2.5 cups) of juice are needed for each cup of soda. We can write this as a ratio with a denominator of one (2.5 c/1 c). This is called a unit ratio and can be used to solve other problems. Students may also use other strategies to solve this problem. Refer students to the Finding Equivalent Fractions and Ratios Menu in the Student Guide Reference section. After students have solved the problem, discuss Jacob and Jackie's strategies.
Have students work in pairs to choose strategies for solving problems in Questions 18–20. Circulate and observe which strategies students are using. Choose student pairs who have used different strategies to demonstrate their solutions using a display.
Display a graph to discuss Question 19.
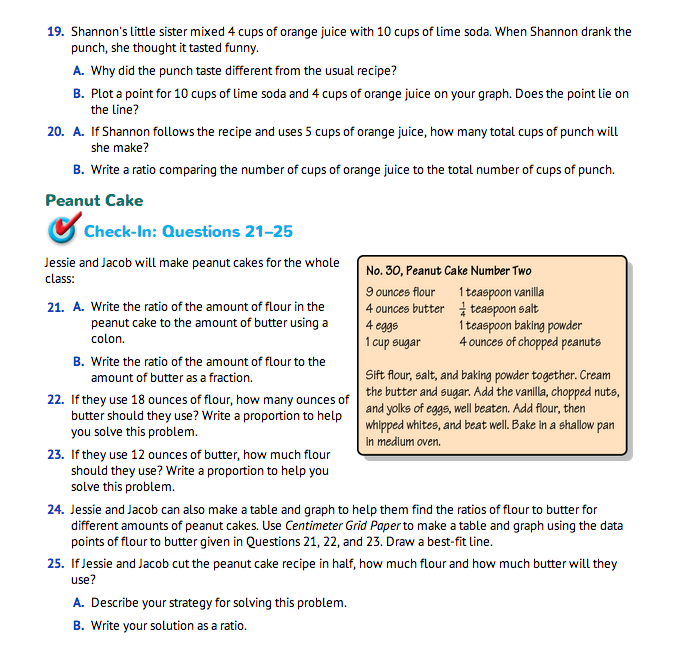
In Question 19 students add the point (10 c, 4 c) to their graph. See Figure 3. This point does not lie on the line, since the ratio corresponding to this point (J/S = 4 c/10 c) is not equal to 5 c/2 c. Since Shannon's little sister did not use the ingredients in the same proportion as Shannon, the punch will not taste the same.
For Question 20, students write the ratio of the number of cups of orange juice to the total number of cups of punch. If Shannon uses 5 cups of orange juice, she will use 2 cups of lime soda and make 7 cups of punch. The ratio of orange juice to punch is 5 c/7 c.