Lesson 1

Ratios, Recipes, and Proportions

Est. Class Sessions: 2–3

Summarizing the Lesson

Assign Check-In: Questions 21–25 in the Peanut Cake section for students to complete independently. Students find and use ratios and proportions to solve problems.

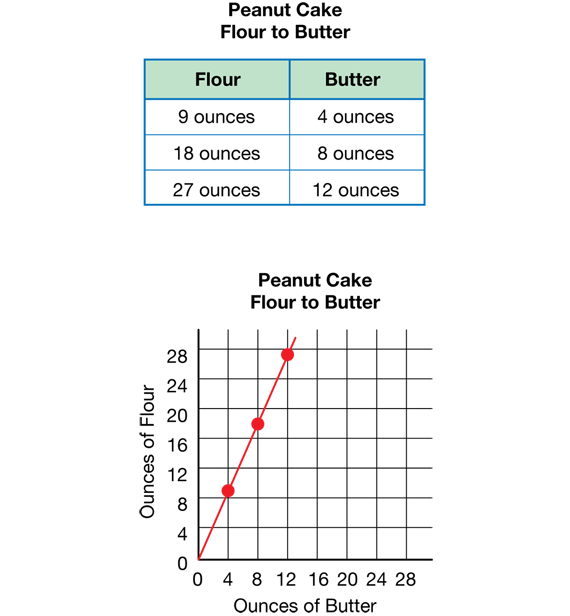
Upon completion, ask student volunteers to display and explain their graphs from Question 24. See Figure 5 for a graph and table. Ask them to demonstrate how to use the graph to determine the amount of flour and butter to use in half of a recipe (Question 25).

Use Check-In: Questions 21–25 in the Ratios, Recipes, and Proportions pages of the Student Guide to assess students' abilities to represent the relationship between variables as a ratio [E2]; use ratios and proportions to solve problems [E4]; collect and organize data into a table and line graph to represent the relationship between variables and to represent ratios and proportional relationships [E10, E11], and use patterns in tables and line graphs to make predictions and solve problems [E12 ].

Ratios of flour to butter in Peanut Cake
X
+