


Sink and Float
Est. Class Sessions: 3
Students find the mass and volume for several objects and observe which objects sink and which objects float in water. Students discover how the ratio of mass to volume predicts whether an object will sink or float.
Content in this Lesson
- Representing the relationship between variables as a ratio [E2].
- Using ratios and proportions to solve problems [E4].
- Collecting and organizing data into a table and line graph to represent the relationship between variables [E10].
- Making point graphs and drawing best-fit lines to represent ratios and proportional relationships [E11].
- Using patterns in tables and line graphs to make predictions and solve problems [E12].
Daily Practice and Problems I–N

Materials for Students
| Daily Practice and Problems | Lesson | Homework | Assessment | ||
|---|---|---|---|---|---|
Student Books |
Student Guide |
|
|
|
|
| Student Activity Book |
|
||||
Teacher Resources |
Teacher Guide - digital |
Supplies for Student Pairs
- two-pan balance
- set of gram masses
- 250-cc graduated cylinder
- small piece of clay for leveling the balance
- paper towels
- water
- eyedropper
- cup or beaker for pouring water
- large container (dishpan) of water
- 1-inch diameter steel sphere
- 1-inch plastic sphere
- several more small objects that sink or float (rock, marble, cork, clay, wood, paraffin block). See Materials Preparation.
- ruler
- calculator
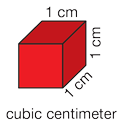
- cubic centimeter cubes for estimating volume, optional
Materials for the Teacher
- Display of Sink and Float Data Tables (Student Activity Book) Page 443
- Display of Centimeter Grid Paper Master (Teacher Guide)
- Unit 11 Assessment Record
- Display of Mass Review Masters (Teacher Guide), optional
- Display of Volume Review Masters (Teacher Guide), optional
Materials Preparation
Choose Several Objects to Sink and Float. See Figure 2 for some suggestions. Include objects that reveal the misconceptions students might have about why things sink or float. Some students think things sink only “because they are big” or “because they are heavy.”
- Choose an object that is large compared to the others but that does not sink, such as a block of paraffin or a piece of plastic foam.
- Choose an object that is heavy compared to the others but that does not sink. The paraffin block serves both of these purposes. A bar of soap that floats also works well.
Paraffin blocks should be available at the supermarket (in the canning section) or at a craft store. Pieces of wood or wax candles float and can be substituted for the paraffin block as long as they are larger and heavier than some of the items that sink.
Prepare Two-Pan Balances. Assemble the two-pan balances, if necessary. Have students zero the two-pan balance to help them understand how this measurement tool works. Demonstrate how to zero the balance by placing a small piece of clay on the high end of the arm to make it level as shown in Figure 1. Have student pairs zero their balances. Through trial and error, they will find the proper amount of clay needed. Allow time for students to explore the two-pan balances before beginning the lesson.

Figure 1: Using clay to zero a two-pan balance
Content Note
The two-pan balance is a measurement tool used to compare the mass of objects. When an object is placed in each pan, the pan containing more mass moves down. If two masses are equal, the pans balance, and the arm of the balance comes to rest in a horizontal position. To work correctly, the balance arm should be horizontal when both pans are empty.
Assessment in this Lesson
| Assessment | Expectation Assessed |
|---|---|
|
Sink and Float |
|