


Mass vs. Volume: Proportions and Density
Est. Class Sessions: 4–5Developing the Lesson
Part 1: Introduce the Lab
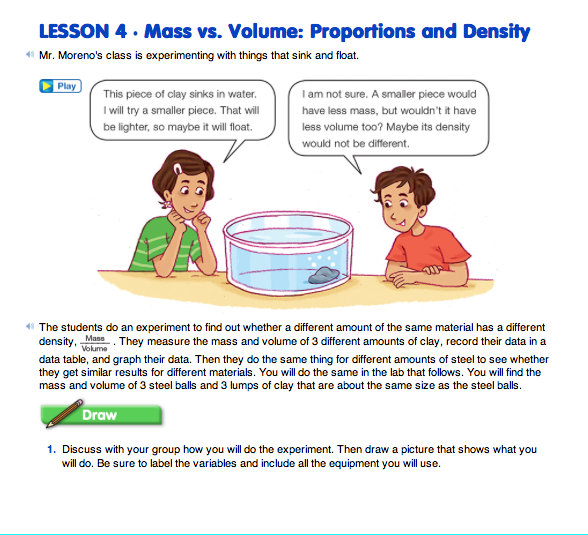
Read together the vignette in the Mass vs. Volume: Proportions and Density pages in the Student Guide, in which students in Mr. Moreno's class wonder whether different amounts of the same material have the same density.
Ask students these or similar questions:
In this lab, students measure the mass and volume of three different amounts of the same material to find out if the density ratios are equivalent. Students complete two experiments, one for clay and one for steel, and plot the data on the same graph.
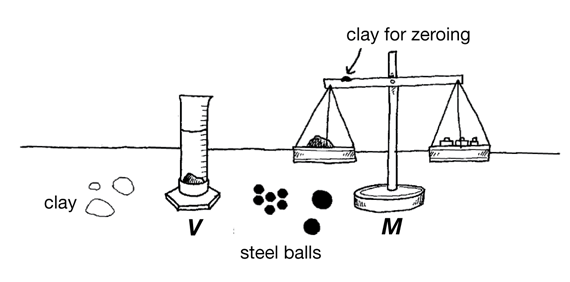
Draw a Picture. Have students draw a picture of what they will be doing (Question 1). They should show all the equipment they will use and label the variables. A sample picture is shown in Figure 1.
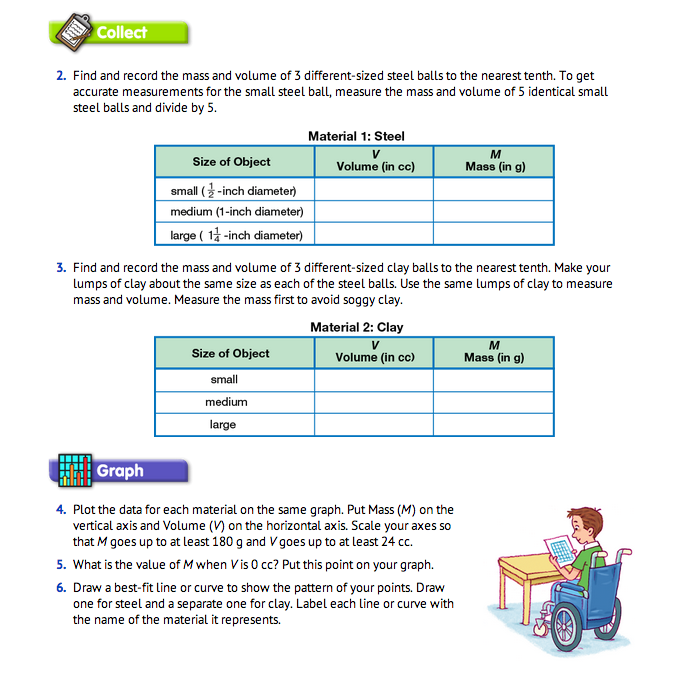
Prepare Data Table. After students have completed their lab drawings, have each student make the steel and clay material data tables as shown in the Student Guide (Questions 2–3). Students can use either a copy of the Three-Column Data TableMaster or a plain piece of paper. Provide each pair of students with the materials for the experiment: two-pan balance, a graduated cylinder, some clay, steel balls (5 small, 1/2-inch, 1 medium, 1-inch, 1 large, 11/4-inch), gram masses, towels, cup of water, and eyedropper.
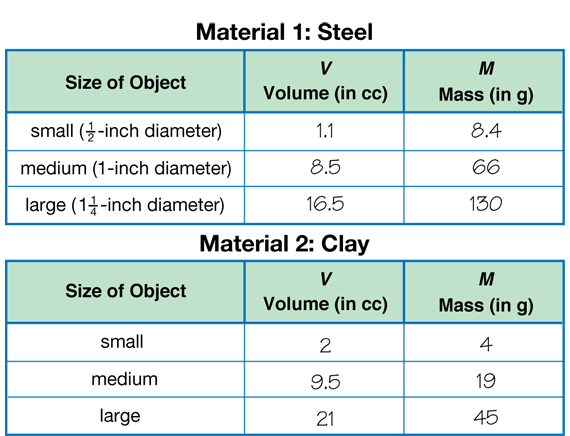
Collect Volume and Mass Data. The smallest steel ball is not big enough to measure accurately. Have students find the volume and mass of 5 steel balls and divide the answer by 5. Have students make the three clay balls roughly the same size as the steel balls. Make the small clay ball a little larger than the small steel sphere, about 2–4 cc. Have students find the volume and mass of steel and clay balls and record their data (Questions 2–3).
Sample data are shown in Figure 2.

Circulate to see how the student pairs use the balance and the graduated cylinder to find the measurements of the steel and clay spheres. Watch to see that students are measuring volume and mass to the nearest tenth.
When student pairs have have completed their data tables, have them share their results with another pair who has completed their data table. Have them discuss the similarities and differences in their data.
Label the Masters. Display the Three-Column Data Table Master. Record and compare some of the students' measurements for Material 1: Steel and Material 2: Clay. If large discrepancies exist among student results, ask students to review the measurement checklist reminders and come up with possible reasons for this. Give students time to go back and re-measure, if necessary.
Graph Data. Students should graph their data on copies of the Centimeter Grid Paper Master. Have students plot volume on the horizontal axis and mass on the vertical axis. This way, the density, M/V, corresponds to the steepness of the line (the denser the object, the steeper the line).
Have students plot their data for each material on the same graph (Question 4) so they can make comparisons. Notice that the point (0, 0) should be included as a data point on the graph (Question 5). This is because an object with 0 volume has 0 mass; in other words, M = 0 g when V = 0 cc.
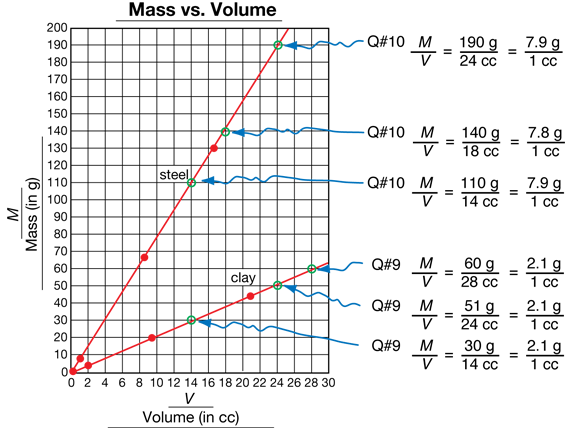
Students' data points should show straight-line patterns. They draw two best-fit lines through their data, one for steel and one for clay (Question 6).A graph of the sample data is shown in Figure 3. You can review how to draw a best-fit line by plotting these data points on a display and then using this display when discussing the Explore questions.
The fact that the mass vs. volume graph of a material is a straight line through (0, 0) is important. This means that the ratio of mass to volume (density) is the same for any amount of material. It also means proportional reasoning can be used to solve problems about mass and volume.
Explore the Data. Assign Questions 7–12. After students have collected their data and made their graphs, they are ready to work on the questions.
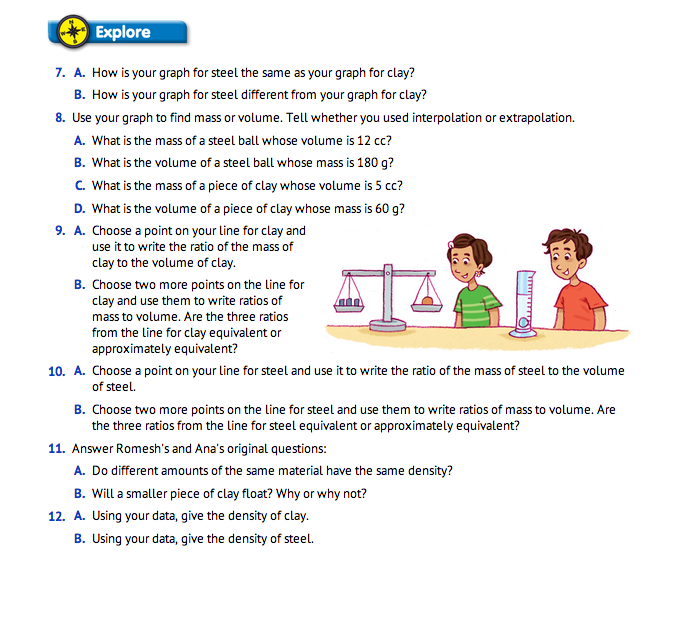
In Question 7A, students observe that the best-fit lines for clay and steel are straight or close to straight and pass through (0, 0). The lines show that the ratios for mass and volume are proportional for steel and proportional for clay. In Question 7B, students find that the best-fit line for steel is steeper than the best-fit line for clay. This shows that steel is more dense than clay, since the steeper the line the more dense the material. For Question 8, students use the best-fit lines on their graph to find the mass and volume of quantities that were not measured, using interpolation or extrapolation. Students' answers may vary a little because of variations in their data and their best-fit lines. Remind them that you expect their answers to come from their own graphs. Consistency with their data is important; matching the answers of a neighbor (or even the sample data) is not as important.
In Question 7A, students observe that the best-fit lines for clay and steel are straight or close to straight and pass through (0,0). The lines show that the ratios for mass and volume are proportional for steel and proportional for clay. In Question 7B, students find that the best-fit line for steel is steeper than the best-fit line for clay. This shows that steel is more dense than clay, since the steeper the line the more dense the material. For Question 8, students use the best-fit lines on their graph to find the mass and volume of quantities that were not measured, using interpolation or extrapolation. Students' answers may vary a little because of variations in their data and their best-fit lines. Remind them that you expect their answers to come from their own graphs. Consistency with their data is important; matching the answers of a neighbor (or even the sample data) is not as important.
For Questions 9A–B, students choose a total of three different points on the line for clay and use them to write ratios of mass to volume. Figure 3 shows three such ratios. Students follow the same procedure for steel in Question 10.
Use Questions 9–10 to lead students to the idea that the ratio of mass to volume (M/V) for clay will be the same for any values of M and V chosen from points on the line for clay. Similarly, the ratio of mass to volume (M/V) will be the same for steel for any values of M and V chosen from points on the line for steel (Question 10). Have students work with a partner to discuss Romesh's and Ana's original questions (Questions 11A–B). Have students use their graph to support their answers (Question 11A). Students can verify this by computing the densities using different points on their lines. Since changing the size doesn't change the density, it also doesn't change whether the material sinks or floats. Thus a smaller piece of clay will not float (Question 11B)–it has the same density as the larger piece (which sinks).
For Question 12, students give the densities using their data. Students may give the density for clay with one of the M/V ratios from their graph or they could reduce it to a unit ratio over 1 cc. The densities should be computed from their lines, not their raw data. The individual data points may give slightly different values of M/V due to inevitable measurement error.
Discuss Data. Once students have completed the Explore section, use Questions 7–12 to guide your discussion.
Ask:
For this reason, the best-fit line gives a value for the density that is more accurate than any of the individual data points (unless they are on the line). For the same reason, the values you get for the densities of steel and clay may be close but not the same as the sample data.
The selected points on the graph in Figure 3 are easy to read. Students could use these or similar points to represent density for clay and steel. Students may describe density as a ratio over 1 cc. For example, we found the density for clay is M/V = 2.1 g/1 cc cc and the density for steel is 7.9 g/1 cc. However, it is not necessary for students to use the unit ratios to compare the density of clay and steel. For example, students could use 110 g/14 cc for steel and 30 g/14 cc for clay and still show that the density of steel is greater than the density of clay.
Lab Assessment. Make a packet of each student's lab work to include their drawing, data table, graph and questions for the Mass vs. Volume: Proportions and Density Lab. Use this work to assess student progress in representing variables and procedures in a drawing, measuring mass and volume to the nearest tenth, collecting and organizing data in a table and a graph, drawing a best-fit line, and using these representations of ratios and proportions to solve problems.

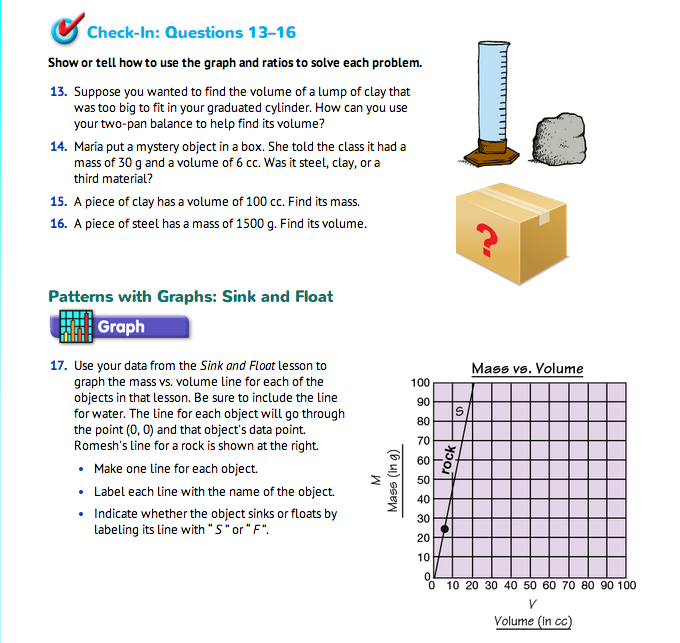
Use Graphs and Ratios to Solve Problems. Assign Check-In: Questions 13–16 for students to complete independently. Students use ratios and proportions from their graph to find the mass and volumes for materials too large to be on the graph to identify a mystery material.
Upon completion, have students share their problem-solving strategies. Use Check-In: Questions 13–16 to guide your discussion.
The two experiments, one for steel and one for clay, show us that density depends on the material. The lines for steel and clay were different. Two different materials will rarely have the same density, or equivalently, the same mass-volume line. Measuring density or graphing the mass vs. volume line of a material can help to identify the material. This idea is applied in Question 14. Maria's mystery object has a density of 30 g/6 cc, or 5 g/1 cc. This is less than the density of steel (about 7.9 g/1 cc) and more than the density of clay (about 2.1 g/1 cc). So the material can't be either steel or clay. Graphically, the point (V, M) = (6, 30) does not fall on the line for steel or clay, so the material must be a third substance.
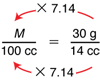
Share Many Ways to Find Mass. In Question 15, students find the mass of 100 cc of clay. This can be done in several ways. One way is to use the line for clay on their graphs to obtain the density of clay. They can use the density to write a proportion involving the mass and volume of clay and then solve this proportion to find their answer. Different student groups will have different numbers in their proportions, but the ratios should be about the same. Using the sample graph and a point where the bestfit line meets two grid lines because it is easier to read accurately, M = 30 g and V = 14 cc. Thus, the density is 30 g/14 cc and the proportion is:

To find M when V = 100 cc, we need to solve the proportion:

The numbers are a little messy here because they come from real data, but we can use what we know about equivalent fractions to help us solve the proportion. We know that the numerators are related by the same factor as the denominators. By what factor can we multiply 14 cc (the denominator on the right) to get 100 cc (the denominator on the left)? The answer is 100 ÷ 14, or about 7.14. Thus, we can multiply the numerator on the right, 30 g, by the same factor, 7.14, to get M, the numerator on the left. Therefore, M ≈ 7.14 × 30 g = 214 g. Note, if students estimate that 100 ÷ 14 is about 7, they would compute that the mass is about 7 × 30 g or about 210 g. Given that there is a certain amount of measurement error, this estimate is acceptable.
Another way to solve the proportion is to find the mass of 1 cc using 30 g/14 cc to solve the proportion. Since 30 × 14 = 2.1, we need to solve:

If 1 cc has a mass of about 2.1 g then 100 cc will have a mass of about 100 × 2.1 g or 210 g.
A third method of solving the problem in Question 15 is to read the volume of a smaller mass that is on the graph and then multiply by an appropriate number to find the volume of the given mass. The value V = 100 cc is not on their graph. However, V = 25 cc is on their graphs. From the graph in Figure 3, the mass of a 25-cc piece of clay is about M = 54 g. A piece of clay that has four times the volume, 100 cc, would have four times the mass as well. Therefore, the mass would be 4 × 54 g = 216 g. The answers using the different methods are about the same. Students' answers will vary slightly based on differences in their data and graphs.
Share Ways to Find Volume. Question 16 is similar to Question 15, but this time the mass is known and students find the volume. One way to solve the problem is to read the ratio M/V from the graph for steel and solve the proportion:

A second way is to read the volume of a suitable smaller mass and multiply. The value M = 1500 g is not on the graph. A good value on the graph to choose for M is 150 g, since 1500 g is an easy multiple of 150 g. From the sample graph, when M is 150 g, V is about 19 cc. A piece of steel that has 10 times the mass, 1500 g, would have 10 times the volume as well. Therefore, V ≈ 10 × 19 cc = 190 cc. Again, students' answers will vary slightly because of differences in their data and graphs.