


Mass vs. Volume: Proportions and Density
Est. Class Sessions: 4–5Developing the Lesson
Part 2: Patterns with Graphs: Sink and Float
Graph Sink and Float Data. Have students work in pairs to graph the mass vs. volume lines for each material they investigated in Lesson 3 Sink and Float (Question 17). They can use the data from that activity to plot the lines on a new sheet of Centimeter Grid Paper. From their graphs for clay and steel, they learned that each material has its own line and that the line passes through (0, 0). Since that is true, they only need one data point, along with (0, 0), to determine a material's line. They should plot the lines on one sheet of grid paper, label each line, and indicate whether the material sinks or floats, as shown in Figure 4. Students can use one color to draw lines for objects that sink, another color for objects that float, and a third color for the line for water. Demonstrate how to do this by graphing a few lines on a display of the Centimeter Grid Paper Master. See Figure 4.
Use Ratios and Patterns. Have students work in pairs or groups to answer Questions 18–23. The students should recognize a pattern (Question 18).
Upon completion, ask:
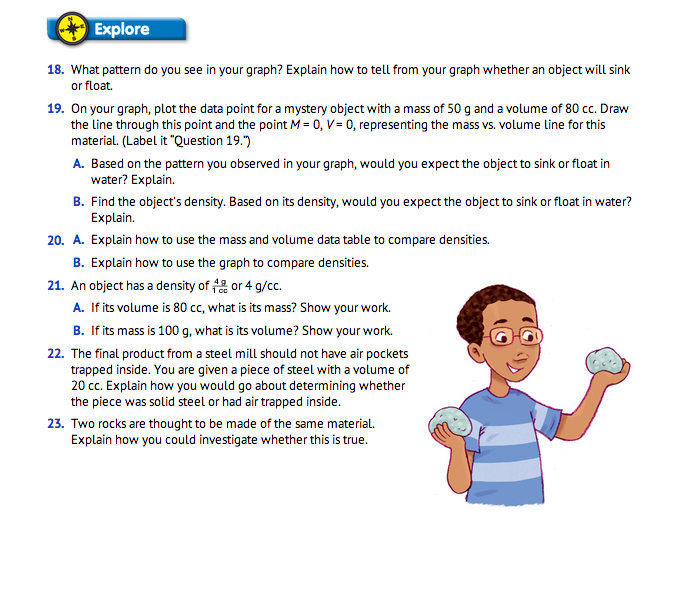
In Question 19, students apply the patterns they have observed to determine whether an object sinks or floats. They use both the pattern with graphs from this lesson and the pattern with densities from the previous lesson. They plot the data point for V = 80 cc and M = 50 g. In Question 19A, they observe that the line for this material is below the water line and so the object floats. In Question 19B, they compute the density directly: M/V = 50 g/80 cc. Since this is less than 1 g/cc (the density of water), the object floats.
In Question 20, students describe two ways to compare the density of materials. One way is to compute the ratio M/V of the materials using values of M and V in the data table (Question 20A). Using a calculator to solve proportions makes comparison easier. In Question 20B, they describe a graphical way to compare densities. A steeper line represents more mass per volume than a line that is not as steep. Hence, it represents a material that is denser.
In Questions 21–23, students describe how comparing densities can help to identify the material of an object. Some students may choose to represent the density as a ratio and solve their problems by comparing ratios; others may choose to solve them graphically by comparing the steepness of the appropriate mass vs. volume line.
Ask:
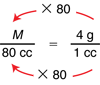
One way to solve Question 21 is to use a proportion. The object has density M/V = 4 g/1 cc. If its volume is 80 cc, we can find its mass (Question 21A) by solving the proportion:

Since the denominator on the left is 80 times the one on the right, the numerator on the left must be 80 times the one on the right. Therefore M = 80 × 4 g = 320 g.