Lesson 5

Explore Circumference and Diameter

Est. Class Sessions: 4
X

Mathematical Standards

5.OA.B
Analyze patterns and relationships. (5.OA.B.3)
5.NF.A
Use equivalent fractions as a strategy to add and subtract fractions.(5.NF.A.1)
5.NBT.A
Understand the place value system. (5.NBT.A.1)

Standards for Mathematical Practice

MP1.
Make sense of problems and persevere in solving them.
MP2.
Reason quantitatively.
MP3.
Construct viable arguments and critique the reasoning of others.
MP4.
Model with mathematics.
MP5.
Use appropriate tools strategically.
MP6.
Attend to precision.
MP7.
Look for and make use of structure.
MP8.
Look for and express regularity in repeated reasoning.

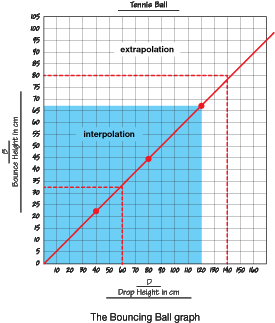
Students explore the relationship between the circumference and the diameter of circles, record their measurements in a data table, plot them on a graph, and analyze their results. Students find that the circumference of a circle is about three times its diameter and equal to π times the diameter.

Content in this Lesson

  • Identifying the parts of a circle [E5].
  • Investigating the relationship between circumference and diameter.
  • Representing the relationship between variables as a ratio [E2].
  • Defining π as the ratio of circumference to diameter of a circle.
  • Finding and expressing the relationship between the circumference and the diameter of circles: C = π × D.
  • Finding equivalent fractions and ratios using a variety of strategies (e.g., using models, using multiplication and division, using graphs and tables) [E3].
  • Using ratios and proportions to solve problems [E4].
  • Measuring the circumference of a circle to the nearest tenth of a centimeter [E8].
  • Representing the variables and procedures of an investigation in a drawing [E9].
  • Collecting and organizing data into a table and line graph to represent the relationship between variables [E10].
  • Making point graphs and drawing best-fit lines to represent ratios and proportional relationships [E11].
  • Using patterns in tables and line graphs to make predictions and solve problems [E12].
  • Knowing the problem [MPE1].
  • Using labels [MPE6].
X

Materials for Students

Daily Practice and Problems Lesson Homework Assessment

Student Books

Student Guide
Student Activity Book

Teacher Resources

Teacher Guide - digital

Supplies for Student Pairs

  • glue
  • string that will not stretch
  • scissors
  • circular objects such as cans and lids of various sizes
  • centimeter ruler
  • calculator
  • adding machine tape, optional

Materials for the Teacher

Materials Preparation

Collect Circular Objects. Collect about 45 lids of various sizes, so that each student pair has three to measure. Gather together a good selection of other small, medium, and large circular objects for students to measure. For example, small objects like spools of thread or Life Savers® rolls; medium objects—soup cans or duct tape rolls; and large objects–coffee cans or paper towel rolls. Ask students to bring these or similar circular objects to school.

Assessment in this Lesson

Assessment Expectation Assessed Math Practices Expectation Assessed

Explore Circumference and Diameter Lab
Student Guide
Pages 553–555
and corresponding
Feedback Box
Teacher Guide - digital

E5.
Identify the parts of a circle.
E8.
Measure the circumference of a circle to the nearest tenth of a centimeter.
E9.
Represent the variables and procedures of an investigation in a drawing.
E10.
Collect and organize data into a table and line graph to represent the relationship between variables.
E11.
Make point graphs and draw best-fit lines to represent ratios and proportional relationships.
E12.
Use patterns in tables and line graphs to make predictions and solve problems.

Explore Circumference and Diameter
Check-In: Questions 20–26
Student Guide
Pages 557–558
with corresponding
Feedback Box
Teacher Guide - digital

E2.
Represent the relationship between variables as a ratio.
E3.
Find equivalent fractions and ratios using a variety of strategies (e.g., using models, using multiplication and division, using graphs and tables).
E4.
Use ratios and proportions to solve problems.
E12.
Use patterns in tables and line graphs to make predictions and solve problems.
MPE1.
Know the problem. I read the problem carefully. I know the questions to answer and what information is important.
MPE6.
Use labels. I use labels to show what number mean.

DPP Item X
Recycle Problem Solving
Teacher Guide - digital

E1.
Represent ratios with words and as fractions.
E2.
Represent the relationship between variables as a ratio.
E3.
Find equivalent fractions and ratios using a variety of strategies (e.g., using models, using multiplication and division, using graphs and tables).
E4.
Use ratios and proportions to solve problems.

DPP Item DD
Different Densities
Teacher Guide - digital

E4.
Use ratios and proportions to solve problems.