Lesson 6

Sampling and Proportions

Est. Class Sessions: 4

Developing the Lesson

Part 1: Sample the Bat Population

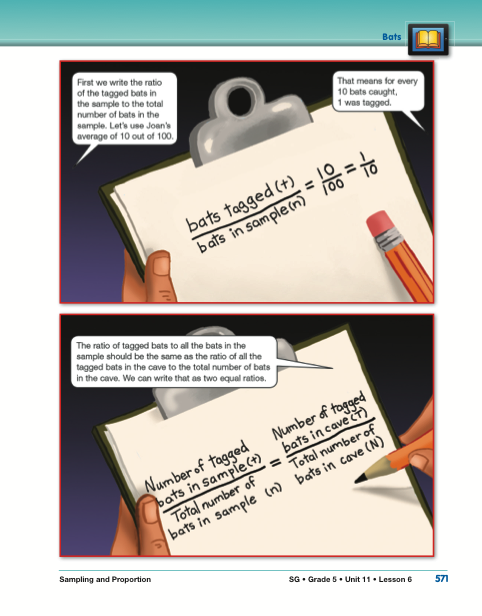
Read and Discuss the Story. Direct students to the Sampling and Proportion pages in the Student Guide. Read the story “Bats.” In the story, Professor John Eagle, Bobby, and Sarah learn about the use of sampling to estimate populations of animals. They use the ratio of tagged bats (t) to the total number of bats (n) in a sample to estimate the number of bats that live in a cave. After reading, discuss the use of sampling by the scientist, Joan, in the story.

  • What does it mean to “tag” a bat? (A small band with identifying information is placed on the bat's wrists.)
  • How many bats did Joan tag over the summer? (1000)
  • Exactly how many bats were caught in the trap after the children's first night? (105)
  • What important data was recorded? (the total number of bats and the number of bats that have tags)
  • Of the 105 bats in the sample, how many had tags? (9)

Pages 571–572

Ask students to turn to the first page showing the ratios.

  • Joan has collected data before. She found an average of 10 tagged bats out of every 100 bats counted. Who would like to write this as a ratio?(10 tagged bats/100 bats in sample)
  • Can you write the ratio a different way, reducing the fraction to lowest terms?(1 tagged bat/10 bats in sample)
  • Is this ratio close to 9 tagged bats/105 bats? Why or why not? (Yes, 9 is close to 10 and 105 is close to 100, so 9/105 is close to 10 tagged bats/100 bats.)
  • How did Sarah and Bobby decide that there were 10,000 bats in the cave? (They used the ratio 1/10. 1/10 is the ratio of tagged bats in the sample to the total number of bats in the sample, t/n. This ratio is equal to the ratio of tagged bats in the cave to the total number of bats in the cave. Since there were 1000 tagged bats in the cave, they used equivalent fractions to solve the proportion to estimate about 10,000 bats in the cave:

Since the Eagle family and the conservation club chose the sample sizes, the number of bats in the sample (n) is the manipulated variable. Since the data resulting from the captures are the number of tagged bats (t), t is the responding variable.

In many of the labs in the curriculum in which students draw best-fit lines, three values for the responding variable are averaged and the average value is plotted on the vertical axis. Averaging the values of the responding variable averages out experimental or measurement error.

In this case, we have multiple values for the manipulated variable as well as the responding variable. The conservation club recaptured the bats four times for each sample size and recorded both the total number of bats in each recapture and the number of tagged bats in each recapture. This resulted in 12 entries in the data table. Instead of recording averages in the data table, we plot all 12 points and use the best-fit line to “average” out the experimental error. Plotting all the data points—instead of averaging the data before plotting points—results in a graph with more information since it also shows the spread of the data.

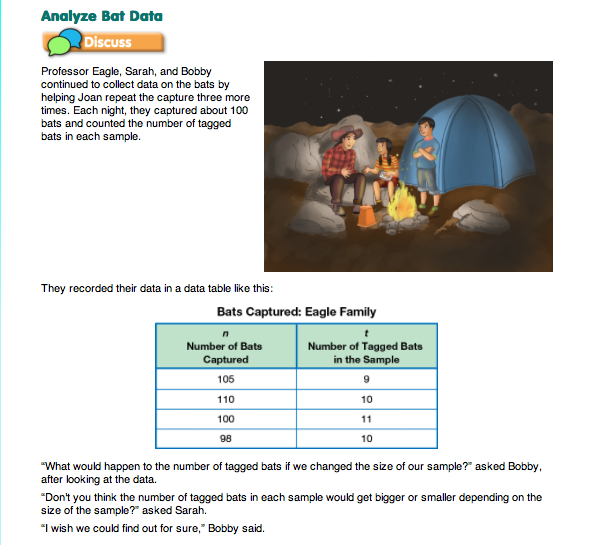
Analyze Bat Data. Read together the vignette that follows the story in the Analyze Bat Data section of the Student Guide. Professor Eagle, Bobby, and Sarah collect data on the number of tagged bats in each capture and record their data in a data table. Distribute Centimeter Grid Paper to each student so that they can graph the Eagle Family's data. Have students work in pairs to complete Questions 1–3.

For Question 1, students make a graph of all the data collected by the conservation club. They plot the number of bats captured (n) on the horizontal axis and the number of tagged bats in the sample (t) on the vertical axis. They then add the data collected by Professor Eagle, Sarah, and Bobby to their graphs in Question 2. Students will see that the points form three distinct clusters or groupings on their graph (Question 3A).

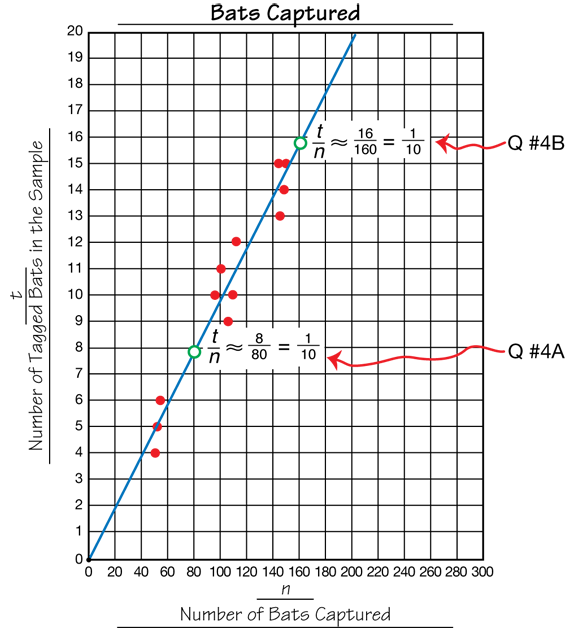
They add the point (n = 0, t = 0) to their graph since there will be no tagged bats when there are no bats in a sample (Question 3B). A best-fit line is then drawn through the points (Question 3C). Remind students that when drawing their best-fit lines, they should try to draw the lines so there are about as many points above the line as below the line. A sample graph is shown in Figure 1.

Assign Check-In: Questions 4–6 for students to complete independently. In Questions 4–6 students use their graph to find ratios, determine if they are equivalent, and use proportional reasoning to solve problems.

Use Check-In: Questions 4–6 in the Student Guide to assess students' ability to represent the relationships between variables as a ratio [E2]; find equivalent fractions and ratio [E3]; and use ratios and proportions to solve problems [E4].

For Question 4, asks students to write two ratios using the best-fit line. Figure 1 shows these ratios. For our best-fit line, when n = 80, t is about 7.8 and when n = 160, t is about 15.7. For the purpose of this activity, it is sufficient to round the values of t to the nearest whole number. So, for n = 80, we get t = 8 and for n = 160, we get t = 16. The two ratios of n to t are equivalent.

8/80 = 16/160 = 1/10

The ratio 1/10 matches the ratio Joan reported in the story, and it is approximately equal to the ratio of tagged bats to bats in the sample that Professor Eagle, Bobby, and Sarah found after their first capture. For Question 5, students choose other points from the line and write ratios corresponding to those points. They can see that all of the ratios t/n are equivalent (or approximately equivalent). Therefore, we can use the ratio of tagged bats in the sample to the total number of bats in the sample, t/n, to estimate the number of bats in the total population.

Discuss Responses. Upon completion of Check-In: Questions 4–6, discuss Question 6. It poses the same question asked by Bobby and Sarah in the vignette at the beginning of the lesson and sets purpose for the lab to come.

  • What happens to the number of tagged bats in a sample as the sample size increases? (The number of tagged bats increases when the sample size increases.)
  • What happens to the number of tagged bats in a sample as the sample size decreases? (The number of tagged bats decreases if the sample size decreases.)
  • Can you use the term “proportion” to explain what happens to the number of tagged bats in a sample as the sample size changes? (The number of tagged bats changes in proportion to the number of bats in a sample.)
X
SG_Mini
+
X
SG_Mini
+
X
SG_Mini
+
X
SG_Mini
+
X
SG_Mini
+
X
SG_Mini
+
A sample graph for Questions 1–2
X
+