


B
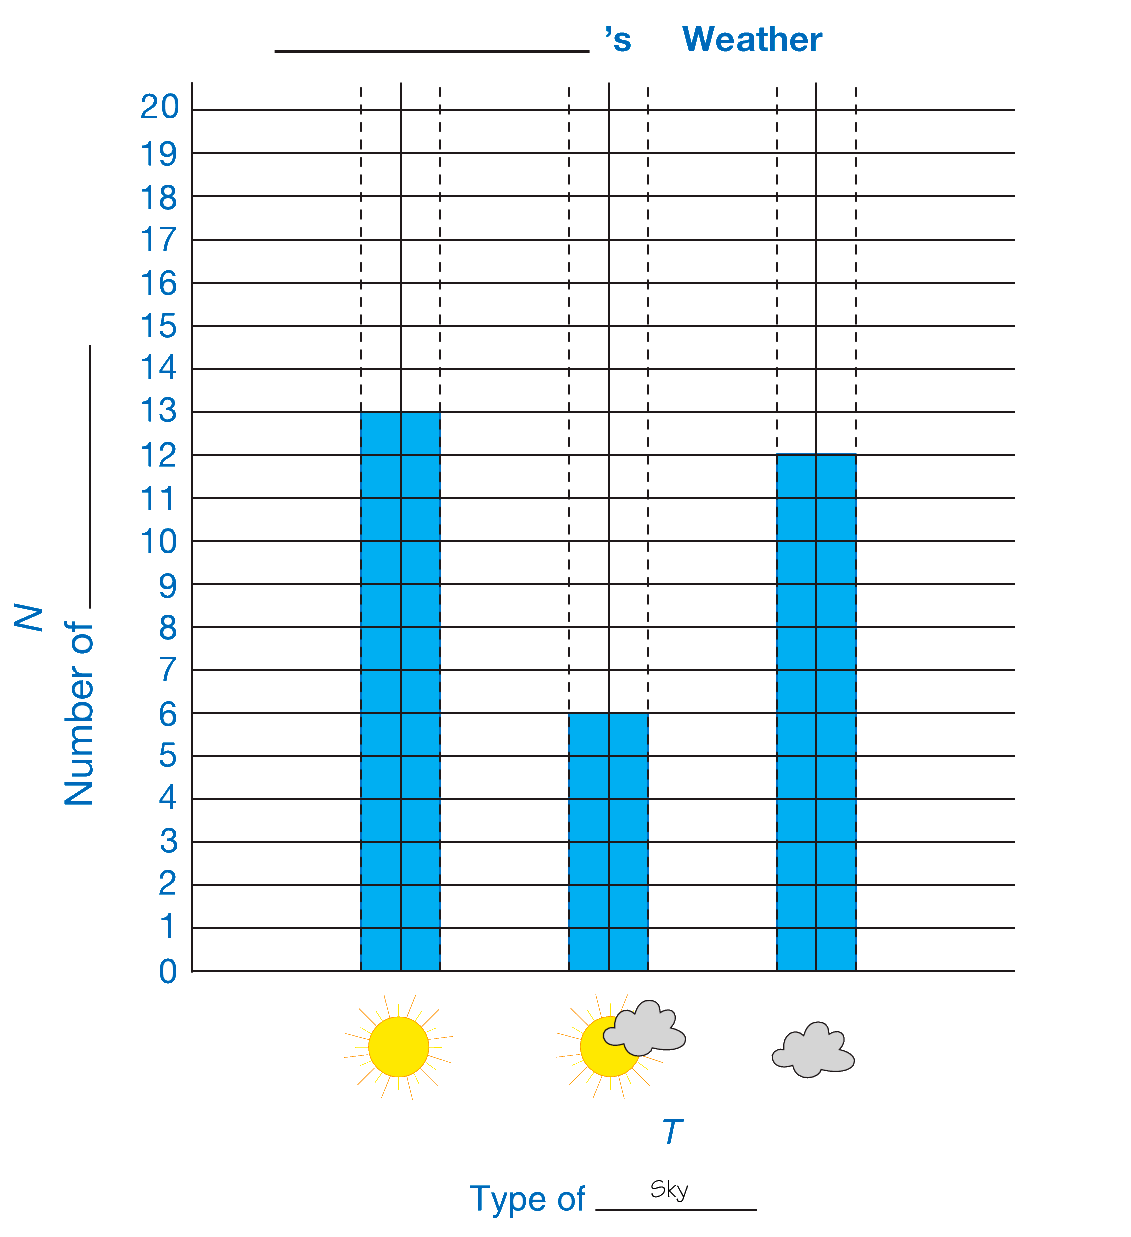
bar graph
A graph that uses bars to show data. (See also graph.)
benchmark
Numbers convenient for comparing and ordering numbers. For example, 0, 50, and 100 are convienient benchmarks for comparing whole numbers.
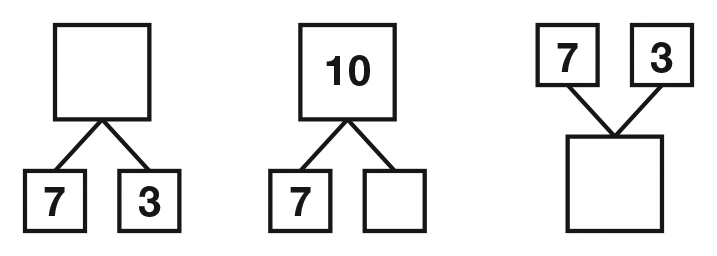
box diagram
A diagram used to show taking apart and putting together numbers to add and subtract. For example, 7 and 3 can be combined to make 10. Or, if 10 is broken into 7 and another part, the other part must be 3.
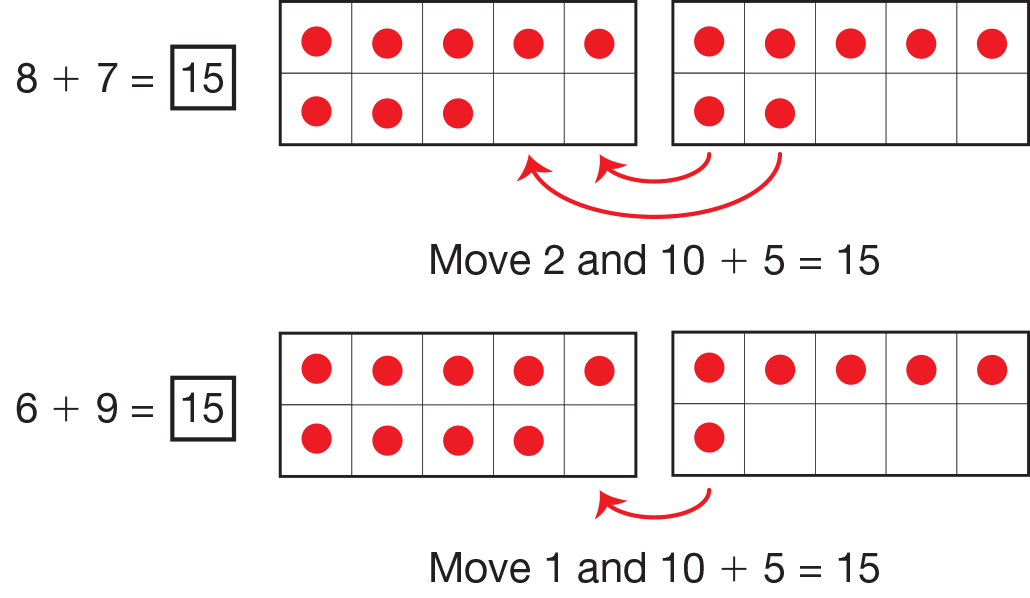
break-apart numbers
A way of breaking a number into parts to help make ten with other addends in the problem.