


Yellow
Green
Blue
Red
Magenta
Remove
LESSON 5 Using Picture Graphs
Ana and Frank were thinking about their school as a population. They decided to use their classroom as a sample of the population to collect data about the types of pets their schoolmates have in their homes. After they collected the data, they decided to organize it using a picture graph.


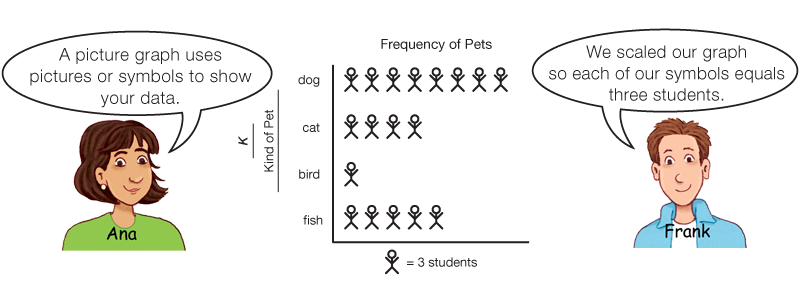
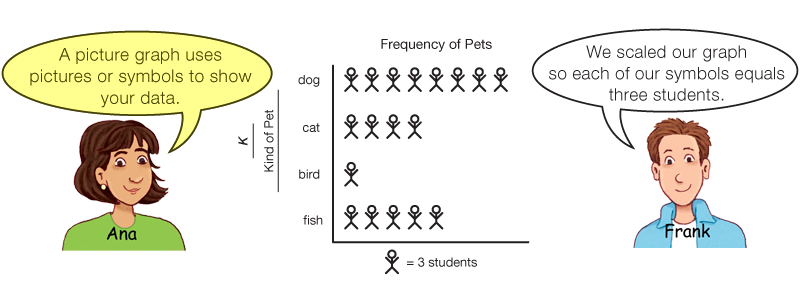
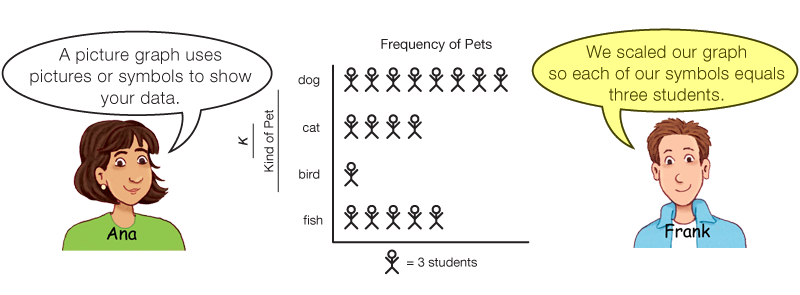
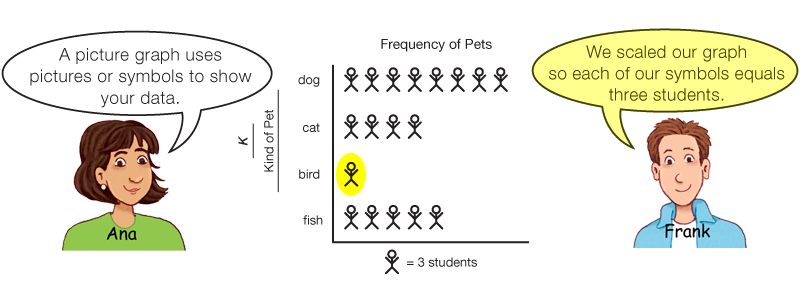
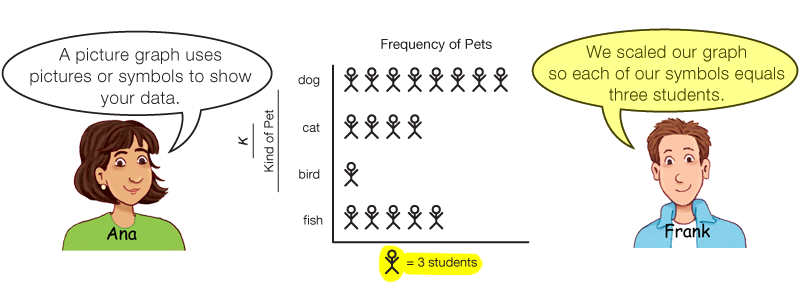

Use Ana and Frank's picture graph to answer the following questions. Be ready to share your answers.
- This picture graph shows that more students have a dog as a pet than any other animal.
- If each stick person symbol represents 3 students, how many students have a dog?
- Show or tell how you know.
- The picture graph shows that a bird is the pet for the fewest number of students.
- How many students have a bird for a pet?
- Show or tell how you know.
- Use the graph to find out how many students have a cat or a fish for a pet.
- What is the difference between the number of students who have a dog and the number who have a bird?
- Ana and Frank collect the same pet data from a different third-grade class in their school. Which pet do you think is most common? Why do you think so?