


Yellow
Green
Blue
Red
Magenta
Remove
If the points on a graph lie close to a line, you can draw a line to help you make predictions. This line is called a best-fit line.
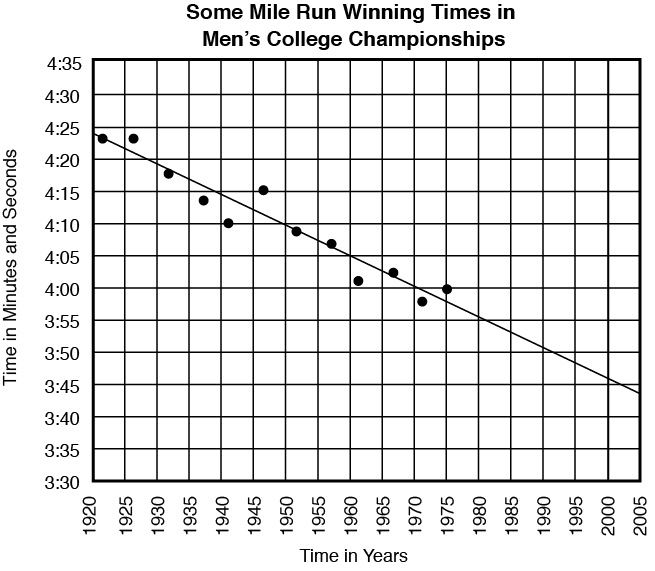
- Why do you think the line drawn on the graph is called a best-fit line?
- How many points on the graph are above the line?
- How many points are on the line?
- How many points are below the line?
- Use this graph to estimate the winning time for the mile run in 1955.
- If the mile had been run in the college championships in the year 2005, predict the winning time. Explain how you made your prediction.