Yellow
Green
Blue
Red
Magenta
Remove

You will need a piece of Centimeter Graph Paper and a ruler to complete this homework.
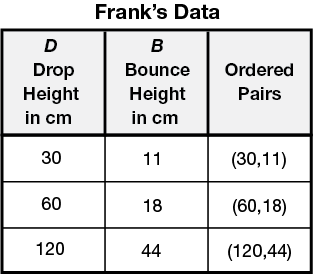
Here are the results of an experiment using a ball Frank found on the way to school:
- Make a point graph of this data. Put the drop height (D) on the horizontal axis and the bounce height (B) on the vertical axis. The scale on the horizontal axis should go to at least 150 cm. The scale on the vertical axis should go to at least 100 cm.
- If the drop height were 0 cm, what would be the bounce height?
- Put this point on your graph.
- Draw a best-fit line. (Remember: This is the
line that is closest to the data points.
It will probably have some points above it
and some below.) - Frank dropped his ball from 150 cm.
- Use your graph to predict the bounce height of the ball. Show how you found your answer on your graph. D = 150 cm, predicted B = ?
- Did you use interpolation or extrapolation to find your answer?
- Frank dropped his ball and it bounced 25 cm.
- From what height was it dropped? Show how you found your answer on your graph. B = 25 cm, predicted D = ?
- Did you use interpolation or extrapolation to find your answer?
- Frank wants his ball to bounce to a height of 100 cm. From what height should he drop the ball? Show or tell how you found your answer.