Yellow
Green
Blue
Red
Magenta
Remove
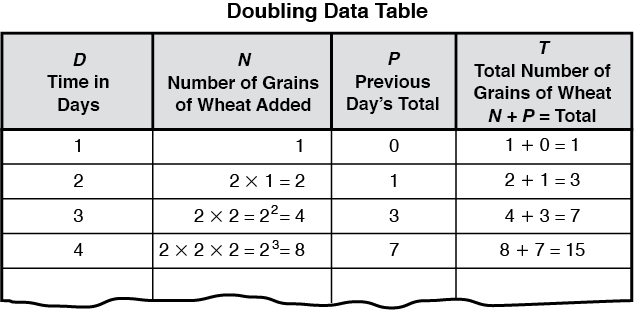
Writing numbers using exponents in the second column may help you see more patterns. Each of the numbers in the second column of the data table are powers of two. For example, 2 2 2 = 23 is read “two to the third power.” We say that 23 is the “third power of two.” Follow the examples to write the powers of two using exponents in your data table. Use a calculator to help you. (Hint: You may need to stop writing 2 2 2 … after several rows.)

- Describe any patterns you see in the table.
- How many grains of wheat will be added on the eighteenth day?
- How many total grains of wheat are needed by the eighteenth day?
- Use the patterns to help you predict when the total number of grains of wheat on the chessboard will reach 1 million.
- Check your prediction. Complete your data table until the total number of grains of wheat reaches a million.

- Make a point graph for the first two columns in your data table on Centimeter Graph Paper. Put the time in days (D) on the horizontal axis. Scale the horizontal axis by ones. Put the number of grains of wheat added each day (N) on the vertical axis. Scale the vertical axis by fours.
- Do the points form a straight line? If so, draw a best-fit line through the points.
- If the points do not form a line, describe the shape of the graph.


