Yellow
Green
Blue
Red
Magenta
Remove
- Predict the volume of 15 small marbles using your graph. Show how you made your prediction. Record your prediction.
- Check your prediction by measuring the volume of 15 small marbles. Record the measured volume.
- How close is your prediction to the measured volume? Is it within 3 cc?
- Look at your data table for the small marbles. Do you see patterns in your data table or ordered pairs? If so, describe them. (Hint: Look down the columns and across the rows. If you know the number of marbles, how can you predict the volume of the marbles?)
- Use your graph to answer the following question: About how much does the volume increase each time you add one small marble?
- Estimate the volume of one small marble. Show or tell how you made your estimate.
- Predict the volume of 24 small marbles. Explain how you made your prediction and record it.
- Check your prediction by measuring the volume of 24 small marbles. Record the measured volume.
- How close is your prediction to the measured volume? Is it within 4 cc or 5 cc?
- Look at your data table for the large marbles. Do you see patterns in the table and ordered pairs? If so, describe them.
- Look at your graph. About how much does the volume increase each time you add one large marble?
- Estimate the volume of one large marble. Show or tell how you made your estimate.
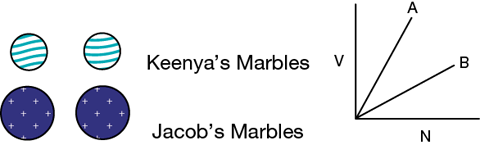
- Two students brought marbles from home. Keenya did the experiment with her marbles and Jacob did the experiment with his. They graphed their data on the same graph. Which line (A or B) did Keenya draw? Explain.