Yellow
Green
Blue
Red
Magenta
Remove
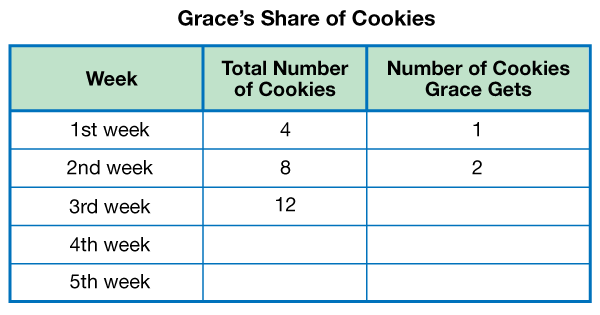
- Draw the table below. Fill in the second column of the table to show how many cookies Grace's grandmother will bring on the 4th week and 5th week.
- How many cookies will Grace get in the 4th week and 5th week if she shares the cookies equally with her three brothers? Explain how you know.
- Fill in the third column of the table with your answers from Questions 1 and 3.
- Make a point graph. Plot the total number of cookies on the horizontal axis and the number of cookies Grace gets on the vertical axis. Remember to title the graph and label the axes. Use a piece of Centimeter Graph Paper.
- If the points form a line, draw a line through the points.
- What does the graph tell you about the number of cookies Grandma brings each week?
- How does the graph show it?
- What does the graph tell you about the relationship between the number of cookies Grace gets each week and the total number of cookies?
- Use the graph to figure out how many cookies Grace gets if her grandmother brings 28 cookies.

In the data table of Grace's share of cookies, data is shown vertically. That means the data is written in columns. Data tables can also be shown horizontally, where the data is shown in rows. Mathematicians sometimes use horizontal tables to show relationships in data. Grace wants to use a horizontal table to show how the numbers of cookies are related as a ratio.


