


Yellow
Green
Blue
Red
Magenta
Remove

- Use the Distance vs. Time Data Table in the Student Activity Book to record your data. Repeat the procedure three times and record the results of all three trials.
- Find the average time for each distance to the nearest second. Use the median as your average.
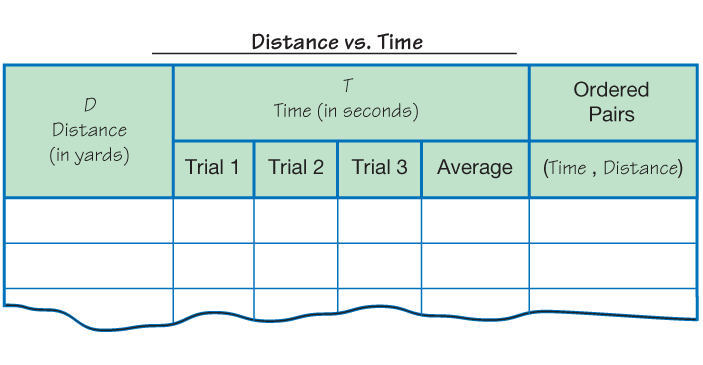

- Make a point graph of your data. Graph time (T) on the horizontal axis and distance (D) on the vertical axis.
- What were the measurements for time and distance when the walker crossed the starting line? (When D = 0 yds, T = ? sec.) Add this point to your graph.
- If your points lie close to a line, use a ruler to draw a best-fit line. The best-fit line is the line that is as close as possible to each point.