


Yellow
Green
Blue
Red
Magenta
Remove

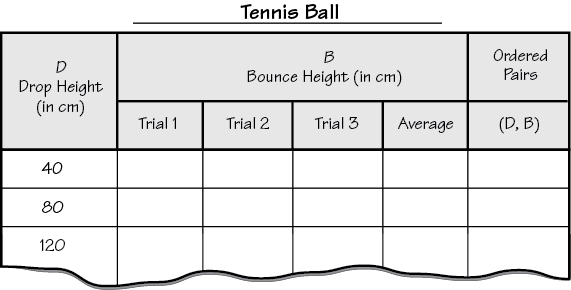
Work with your group to collect the data for each experiment. You will need the two data tables from the Bouncing Ball Lab pages in the Student Activity Book. Use one table for each type of ball.
- Tape two meter sticks to the wall. Your teacher will show you how.
- Fill in the values for the drop height before starting. Follow the example.
- For each drop height, do three trials. Find the average bounce height for each trial. Record the average in the data table.

- Use two pieces of Centimeter Graph Paper to make a point graph of your data for each experiment.
- Put the drop height (D) on the horizontal axis. Put the bounce height (B) on the vertical axis.
- Use the same scales on both graphs. Leave room for extrapolation.
- Remember to title the graphs, label the axes, and include units.
- Plot the average bounce height for each drop height.