Yellow
Green
Blue
Red
Magenta
Remove
Use Sharon and Domingo's Data
Complete Questions 1–7 after reading the first part of the story Two Heads Are Better Than One.
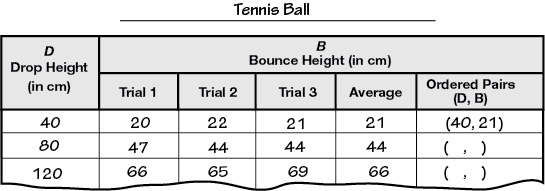
- Here is Domingo and Sharon's data. Fill in the ordered pairs. Graph the data on the Graph Paper for Sharon and Domingo's Data in the Student Activity Book.
- If Sharon “drops” the ball from 0 cm, will it bounce at all? That is, if D = 0 cm, B = ? . Add this point to the graph.
- If the points lie close to a line, use a ruler to draw a best-fit line on your graph.
- Look at Domingo and Sharon's data table in Question 1. What patterns do you see in the table?
- Did Sharon and Domingo use the mean or median to average their data? Show or tell how you know.
- Use your graph to predict the bounce height if the drop height is 60 cm. Show your work on the graph.
- Use your graph to predict the bounce height if the drop height is 160 cm. Show your work on the graph.
- Compare your prediction to the predictions made by Sharon and Domingo in the story.