


Yellow
Green
Blue
Red
Magenta
Remove
- Use your graph to predict the mass of the sandwich after your sixth bite. Write down your prediction.
- Check your prediction by collecting data for 6 bites. Is your prediction close to the actual mass?
- Look at your data table and graph to answer these questions.
- Look down the columns on your data table. Does the number of bites increase or decrease? Describe any pattern you see.
- Does the mass increase or decrease? Describe any pattern you see.
- Use your graph to answer the following question: How much does the mass change each time you take one bite?
- Estimate the mass of one bite. Show or tell how you made your estimate.
- Predict how many bites it would take for you to eat your entire sandwich. Show or tell how you made your prediction.
- Finish your sandwich and check your prediction.

- Plot your partner's data on your graph. Compare your graph and data with your partner's. How are they the same? How are they different?
- Who has a bigger bite size, you or your partner?
- Which student had the larger sandwich?
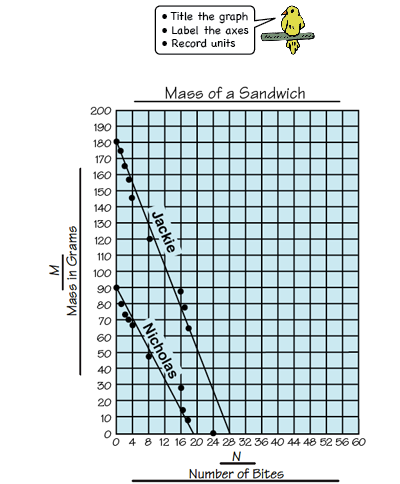
- Two students' lines for the experiment are shown below. Tell a story for this graph. Include in your story which student had the sandwich with the most mass and which student took bigger bites.