


Yellow
Green
Blue
Red
Magenta
Remove
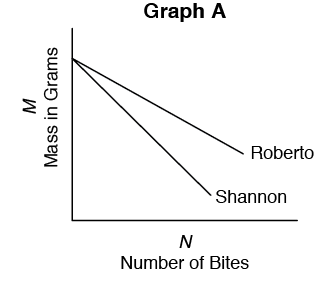
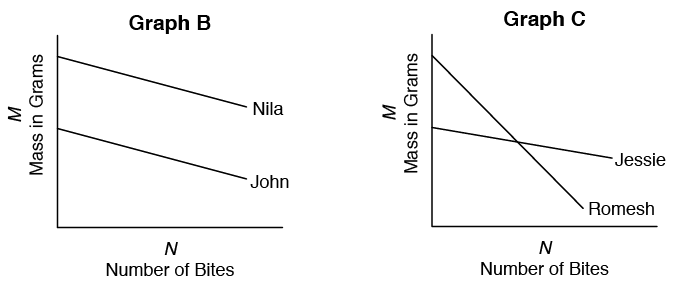
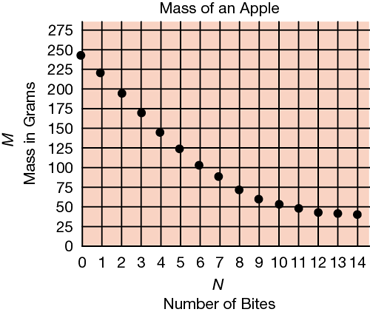
- Three pairs of students do a similar experiment. They mass a sandwich, then record the mass after one bite, two bites, and four bites have been eaten. Then they draw a best-fit line.
- Tell what is the same and different for each graph.
- For each pair, what does the graph say about the mass of each sandwich?
- For each pair, what does the graph say about the size of the students' bites?
- Romesh did this lab with an apple. He plotted his data in a graph. Tell a story about the graph.
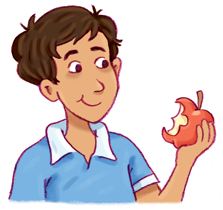
Use the Graph Stories pages in the Student Activity Book for more practice reading point graphs.