Yellow
Green
Blue
Red
Magenta
Remove
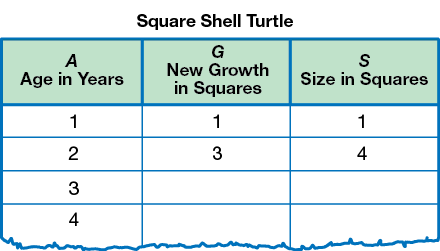
LESSON 4 Square Number Patterns
Another creature on Planet Gzorp is the Square Shell Turtle. Each year its shell grows larger by adding squares that are a different color from the year before.
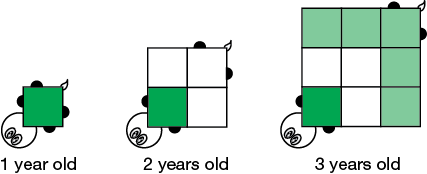
- Use square-inch tiles to build a model of a Square Shell Turtle as it grows up to at least age 8. Record the data as you build each square in a table like the one below. The new growth in squares (G) is the number of new squares you add for that year.
- Graph your data on two separate graphs. Use Half-Centimeter Graph Paper.
- On the first graph, the horizontal axis represents the age in years (A) and the vertical axis represents the new growth in squares (G).
- On the second graph, the horizontal axis represents the age in years (A) and the vertical axis represents the size in squares (S).
- For each graph, draw the line or curve that goes through all the points.
- If your points lie close to a straight line, use a ruler to draw a best-fit line.
- If your points do not lie close to a straight line, then draw a curve that goes through all the points.
- Decide whether your line or curve should go through the point (0, 0).