


Yellow
Green
Blue
Red
Magenta
Remove
- Look back at Room 204's graph called Number of Blocks We Live from School. Is the variable they graphed on the horizontal axis numerical or categorical?
- Is the variable they graphed on the vertical axis numerical or categorical?
- Would Room 204's graph be as easy to read if the numbers (values) on the horizontal axis were not in order? Explain.
- Does it matter in what order you label the horizontal axis when the variable is categorical? Refer back to Room 204's Main Interests graph in Lesson 1.
- What story does the graph tell you about the students in Room 204?
- How many students in Room 204 live 3 blocks or less from school?
- Is this more or less than half the class?
Check-In: Questions 11–14
You will need one sheet of Centimeter Graph Paper to complete this Check-In.
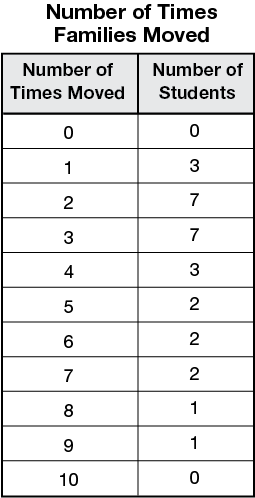
- Room 204's Phoenix pen pals sent back the following data on the number of times their families have moved. Use the data to create a bar graph. Remember to label the axes and title your graph.
- Answer the following questions using the bar graph you drew in Question 11.
- Is the variable on your horizontal axis numerical or categorical?
- Is the variable on your vertical axis numerical or categorical?
- Which is the tallest bar on the graph? What does it tell you?
- What is the most number of times any student has moved? How do you know?
- Describe the shape of your graph.