Yellow
Green
Blue
Red
Magenta
Remove
- Use a red pen or marker to plot the data point for the median height and arm span on your graph.
- Where is the data point for the median values compared to the other data points on the graph?

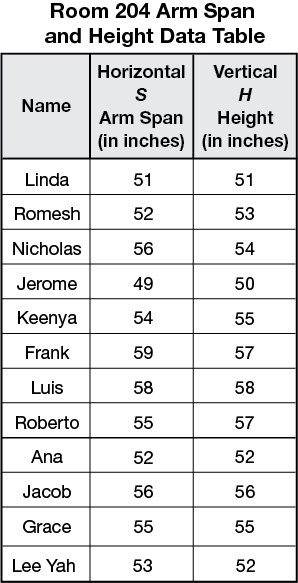
- The data table shows data for some students in Room 204. Write Linda's and Romesh's data as ordered pairs.
- Graph this data on a sheet of Centimeter Graph Paper. Title the graph so that you know it is not your class data. Plot arm span on the horizontal axis and height on the vertical axis. Remember to label your axes and include units.
- Use the graph to estimate the average arm span of the group.
- Estimate the average height using the graph.
- How does the graph of this data compare to your own class graph?
- What is the median arm span for this data?
- What is the median height for this data?
- If a new fourth-grader who entered Mrs. Dewey's classroom had an arm span of 54 inches, what would you predict about the student's height? How did you make your prediction?
- If you measured the arm spans and heights of the parents of classmates in Mrs. Dewey's classroom, where would the data cluster? Show your answer by drawing an oval on your graph of Arm Span vs. Height for the groups in Room 204. How did you decide where to draw the oval?