


Yellow
Green
Blue
Red
Magenta
Remove
Reading Bar Graphs
Check-In: Question 5
The ornithologists counted the total number of each type of bird they captured in one day. The bar graph displays the data. Use the bar graph to answer Questions 5 and 6.
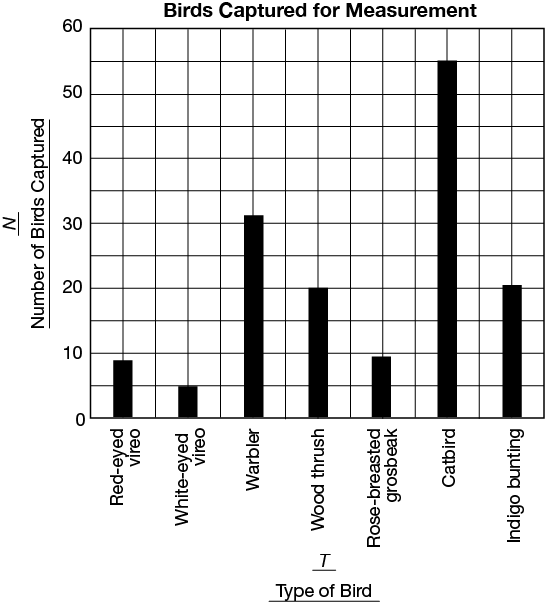
- What are the variables shown in the graph?
- Are the variables categorical or numerical?
- How many warblers were captured?
- How many indigo buntings were captured?
- Which type of bird was captured the most?
- Which type of bird was captured the least?
- Describe two other things that the graph tells you.