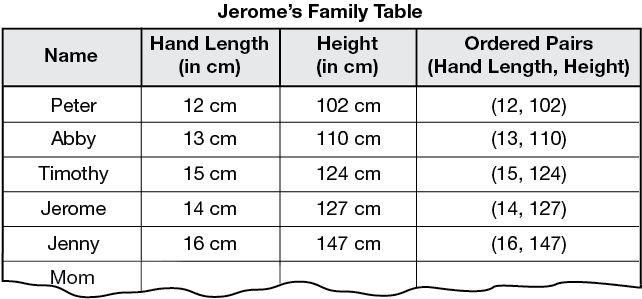
Jerome showed his data table to his mom and told her he was going to make a point graph of the data. She asked, “Which axis are you going to use for the hand length?” Jerome thought a minute and then decided to use the horizontal axis. She said, “Let me show you a way to record your data to make it easier to graph.” Jerome's mom made a data table that looked like this.

Jerome said, “Oh, I see. The last column just gives me the numbers to put on the graph.”
“Yes,” said his mother, “we call those ordered pairs.”

- What do you notice about how Jerome's mother wrote the numbers?
- Name three things that are the same about all the ordered pairs.
Jerome's point graph of his family's data is on the next page.
Jerome graphed hand length on the horizontal axis and height on the vertical axis. To plot a point for his brother Peter's data, he first located his hand length, 12 cm, on the horizontal axis. Then he found his height, 102 centimeters, on the vertical axis.
Mathematicians and scientists use ordered pairs to identify locations on graphs. The ordered pair for Peter's measurements is:
(12, 102)


