Yellow
Green
Blue
Red
Magenta
Remove

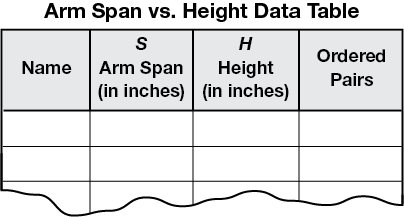
 Measure the arm span and height of each person in your group to the nearest inch. Record your group's data in a data table like the one at the right or use a Four-Column Data Table. Write your data as ordered pairs. Discuss with your group what the letters S and H stand for.
Discuss any patterns you see in the data table.

- Graph your group's data. Plot arm span on the horizontal axis and height on the vertical axis. Scale your horizontal axis to at least 75 inches and the vertical axis to at least 100 inches. Remember to label each axis. Use the Centimeter Graph Paper.
- A class graph of Arm Span vs. Height will provide more data for you to analyze. Plot one point, your own data for arm span and height, on the class graph.

Use your class data and your graphs to help you and your group answer the following questions. Include units with your answers. Be ready to share your answers with the entire class.
- What is the same about all the people you measured for this experiment?
- Describe your group's graph. What do you notice about the points?
- Describe the class graph. What do you notice about the points?
- Compare your group's graph and the class graph. How are they alike and how are they different?


