Yellow
Green
Blue
Red
Magenta
Remove
- Describe the shape of your graph.
- How many bars are on your graph?
- Are the bars all about the same height or are some bars much taller than others?
- Are the tallest bars at the beginning, middle, or end of the graph?
- Why do you think your graph has the shape that it does?
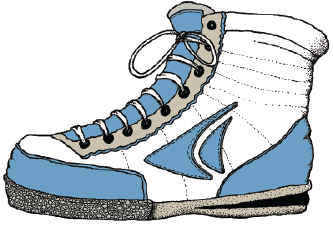
- Describe the Eyelets graph for a professional basketball team in uniform. How many eyelets would team members have? Why do you think so?
- Describe the Eyelets graph if you collected data at the beach. Would the tallest bars be at the beginning, middle, or end of the graph? Would there be many bars or just one or two? Why do you think so?
- What is the total number of eyelets in your class? How do you know?
- Estimate how many eyelets are on all the shoes of all the fifth-grade students in your school. Explain how you made your estimate.
- What would the graph look like if you gathered data from all the fifth-graders in your school? How would it be different from your class graph?


 A Matter of Survival


