Yellow
Green
Blue
Red
Magenta
Remove
LESSON 5 Represent Data with Line Plots
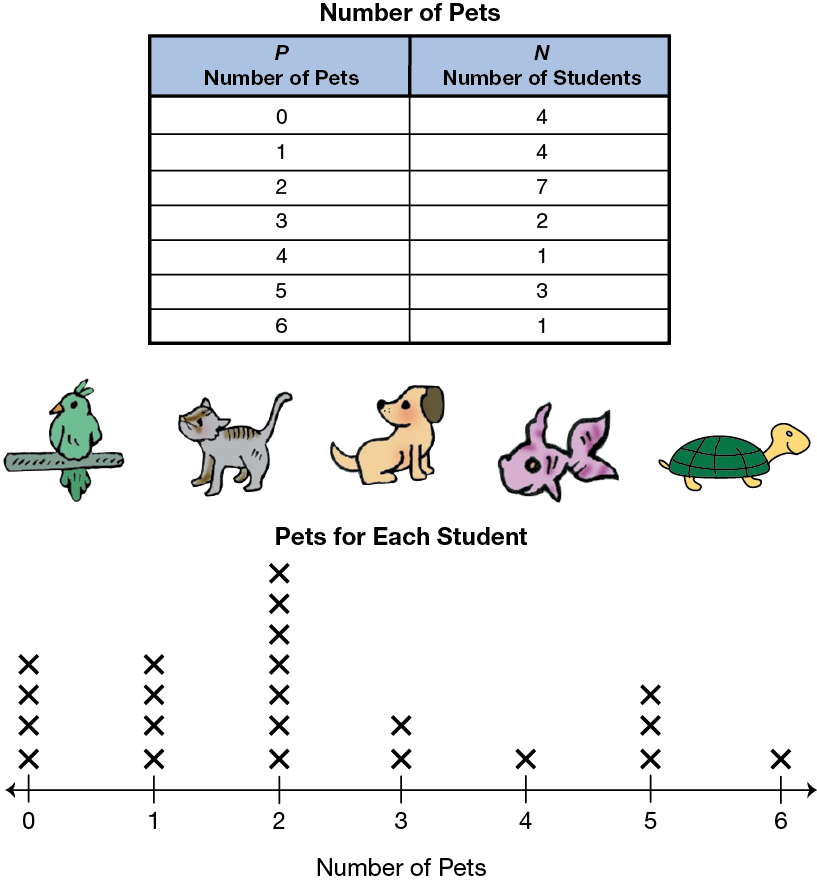
The students in Mr. Moreno's classroom decided to collect more data about their class to help them get to know one another better. Before they began, Mr. Moreno showed the students how they could use a line plot to represent their data. He explained that line plots were another tool they could use to quickly organize and compare information. Mr. Moreno used the class data table about the number of pets each student has to make a line plot.


 A Matter of Survival


