A Matter of Survival

Yellow
Green
Blue
Red
Magenta
Remove
Reviewing Averages
A graph is a good way to represent a set of data since it gives us a picture of all the data. Another way to represent a set of data is to find an average. An average is one number that can be used to represent a set of data.
There is more than one way to find an average. The mode is one kind of average. In Lesson 1, you learned that the mode is the most common value in a set of data.
- Find the mode for each set of survey data represented by the graphs in Question 1.
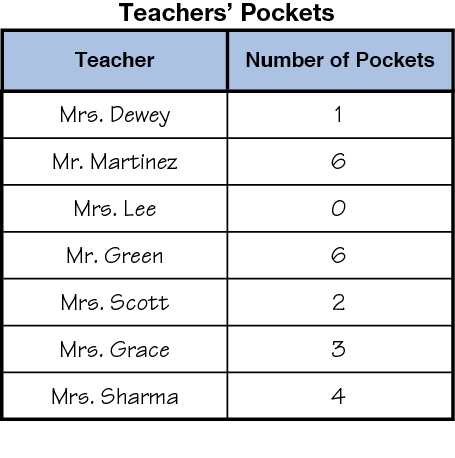
- Professor Peabody returned to Bessie Coleman School to get his pictures and data tables. While he was there, he collected data on the number of pockets the teachers had.
- What is the mode for the data in the table below?
- Does it make sense to say this number of pockets is typical for the teachers? Why or why not?