Yellow
Green
Blue
Red
Magenta
Remove


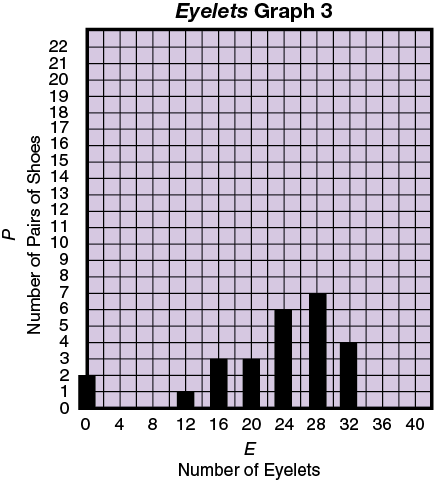
- Tell which graph you think goes with each school. Explain why you think so. (Hint: Tell why the bars on each graph are where they are.)
- What is the mode for each graph? (The mode is the most common number of eyelets.)
- Which graph is most like your class's graph? Which school do you think is most like your school? Explain.
- What would an Eyelets graph look like if you collected data from all the adults at your school? Describe the graph using words, a sketch, or both. Be ready to explain your thinking.


 A Matter of Survival


