A Matter of Survival

Yellow
Green
Blue
Red
Magenta
Remove
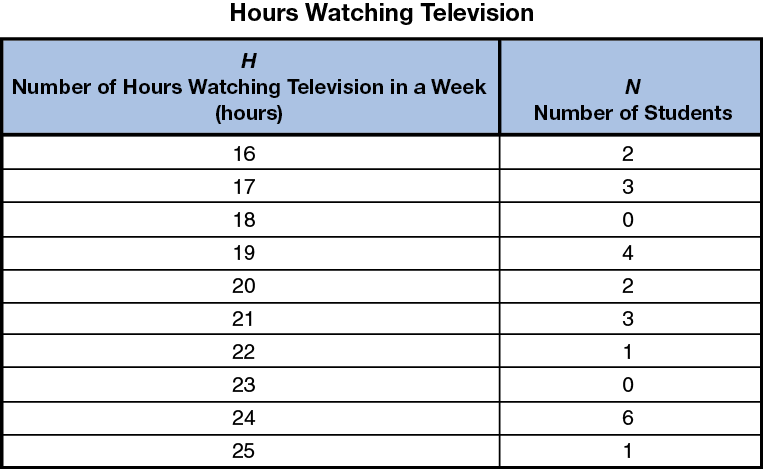
- Irma read that, on average, ten- and eleven-year olds watch about 24 hours of television each week. She wanted to see if her class was typical so she asked her classmates to keep track of the amount of television they watched in a week. She collected and organized the information in a data table.
- What two variables did Irma choose to study?
- Are the variables categorical or numerical?
- Use a piece of Centimeter Graph Paper to make a bar graph of Irma's data in Question 5.
- How many students watch 20 or fewer hours of television each week? Show how you decided.
- How many total hours of television did Mr. Moreno's class watch during the week data was collected?
- What is the median number of hours the students spent watching television in a week?
- What is the mode number of hours students spent watching television in a week?
- Which number, the median or the mode, do you think is a better representation of what is a typical number of hours watching television? Explain your thinking.
- Does the data that Irma collected show that the students in her classroom are typical when compared to the research that Irma read about television viewing? Explain how you decided.