Yellow
Green
Blue
Red
Magenta
Remove
- Use your graph to find the number of cups of orange juice to mix with 6 cups of lime soda.
- Use your graph to find the number of cups of lime soda to mix with 35 cups of orange juice.

Using the graph to find an amount of soda or juice that lies between two data points you plotted on the graph is called interpolation. “Inter” means between points.
Using the graph to find an amount of soda or juice that lies beyond the points you plotted is called extrapolation. “Extra” means beyond or outside.
- Did you use interpolation or extrapolation to answer Question 12A?
- Did you use interpolation or extrapolation to answer Question 12B?
- Choose a point on the line and circle it. Use this point to write a ratio of the amount of orange juice to the amount of lime soda.
- Circle two more points on the line and use them to write ratios of the amount of orange juice to the amount of lime soda.
- Are the three ratios equal? How do you know?
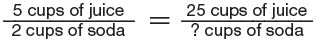
- Find the number of cups of lime soda to mix with 25 cups of orange juice. How did you solve this problem?
- One way to solve this problem is to use a proportion. Find ? so that the number sentence is true.
- Use a proportion to find the number of cups of orange juice to mix with 18 cups of lime soda.
- Use a proportion to find the number of cups of lime soda to mix with 55 cups of orange juice.
- Show how to solve 16A with the graph you made in Question 10.