Yellow
Green
Blue
Red
Magenta
Remove
Orange Punch
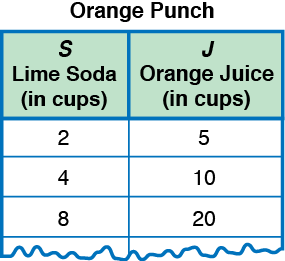
Shannon plans to make punch using a family recipe. She mixes 5 parts orange juice with 2 parts lime soda. For example, if she uses 5 cups of orange juice, she uses 2 cups of lime soda. Shannon makes a chart so that the other members of the class can help her make different amounts of punch.

- Write the ratio of orange juice to lime soda with a colon.
- Write this ratio as a fraction.
- Describe any patterns you see in the table.
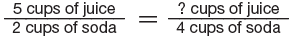
- If Shannon uses 4 cups of lime soda, how many cups of orange juice does she use? Write your solution as a proportion:
- If Shannon uses 20 cups of orange juice, how many cups of lime soda does she use? Write your solution as a proportion.
- Shannon can also use a graph to help her make different amounts of punch. Make a graph of the data in the table.
- Plot the amount of lime soda on the horizontal axis. Scale the horizontal axis from 0 to at least 30.
- Plot the amount of orange juice on the vertical axis. Scale the vertical axis from 0 to at least 40.
- Decide whether Shannon should use a point graph or a bar graph.
- If you graph points that form a line, use your ruler to fit a line to the points. Extend your line in both directions.
- Describe your graph. (Where does it meet the vertical axis? Is it a straight line or a curve? Does it go up or down as you read from left to right?)