


Yellow
Green
Blue
Red
Magenta
Remove
- Look at the data in your table.
- If you had only taken one sample, would the data give you a good estimate for the total number of beans in your bag? Why or why not?
- You took four samples for each sample size. Do you recommend the same, more, or fewer samples? Why?

You will need a piece of Centimeter Grid Paper and a ruler to complete the homework.
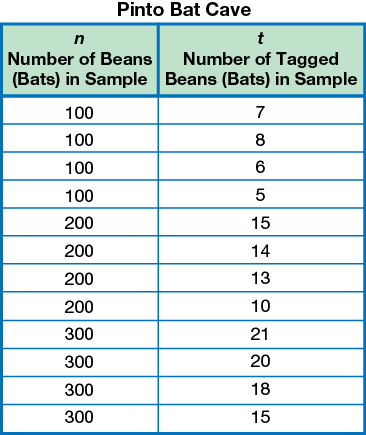
This is Arti and Lee Yah's data. They captured samples of 100, 200, and 300 bats (pinto beans) from a cave (bag).
- Graph Arti and Lee Yah's data. Plot the number of beans in the sample (n) on the horizontal axis and the number of tagged beans (t) on the vertical axis.
- If Arti and Lee Yah have no beans in a sample, how many tagged beans will they find? (n = 0, t = ?) Add this point to your graph.
- Draw a best-fit line.
- Use the line to find the number of tagged beans that would be expected in a sample of 150 beans.
- Use the line to find the number of tagged beans that would be expected if Arti and Lee Yah take a sample of 400 beans.
- If there are a total of 200 tagged beans in the bag, calculate an estimate for the total number of beans in the Pinto Bat Cave. Show or tell how you made your estimate.