


Yellow
Green
Blue
Red
Magenta
Remove
- Describe two features that graphs of variables in proportion have in common.
- Choose one of the graphs from Question 12 that represents variables that are not in proportion. Choose a value of one of the variables and double it. Does the corresponding value of the other variable double? Show your example. How is this different from variables that are in proportion?
Using Graphs to Solve Variables in Proportion Problems
John dropped a tennis ball from three different drop heights (D), 40 cm, 80 cm, and 120 cm, and measured how high it bounced (B). He made the following graph of his data.
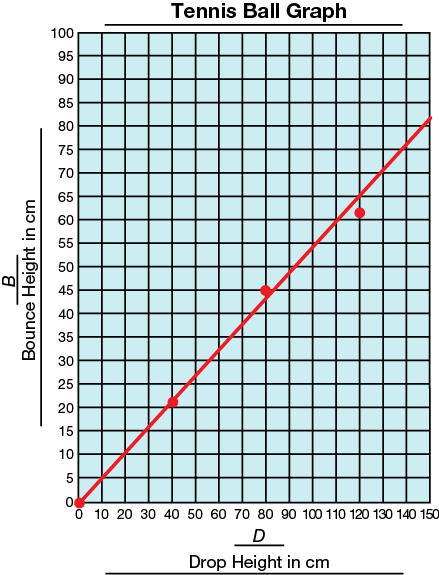
John and Felicia wondered how high the ball would bounce if it were dropped from D = 200 cm, but the numbers they wanted are not on the graph. They thought of two different ways to solve this problem.