Yellow
Green
Blue
Red
Magenta
Remove

Use your graph to answer the following questions. Show your work on your graph.
- Describe your graph.
- If the points on your graph suggest a line, use a ruler to draw a best-fit line.
- If a circle has a diameter of 5 centimeters, what is its circumference?
- Did you use interpolation or extrapolation?
- If a circle has a circumference of 70 centimeters, what is its diameter?
- Did you use interpolation or extrapolation?
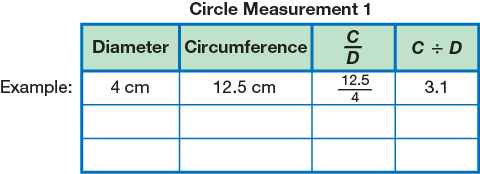
- Use points on your line to find three ratios. Make a table like the one shown here. The first row in the table shows an example. (Do not include this example in your data table.)
- Is the ratio about the same for each diameter?
- Press the
 key on your calculator. Compare the number in the window of
your calculator to the numbers in the last column of the data table in
Question 14. Are they similar?
key on your calculator. Compare the number in the window of
your calculator to the numbers in the last column of the data table in
Question 14. Are they similar?