Yellow
Green
Blue
Red
Magenta
Remove
Check-In: Questions 9–12

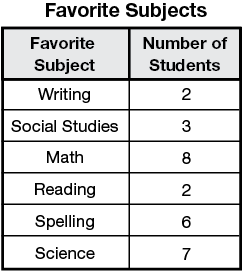
- Room 204's pen pals in Phoenix sent back data on their favorite subjects. Use the data to create a bar graph. Remember to label the axes and title your graph. Use Centimeter Graph Paper.
- What variable is on the horizontal axis?
- What are the values for this variable?
- What variable is on the vertical axis?
- Answer the following questions based on the graph you created in Question 9.
- What is the most common favorite subject?
- What is the least common favorite subject?
- Which of the subjects in the data table is your favorite?
- How many of the Phoenix pen pals have the same favorite subject as you do?
- How many students are in the Phoenix class? Show or tell how you know.


